
The Support and Resistance Indicator is a practical indicator for any technical analyst.
This Forex indicator is a linear indicator that will definitely help any trader who knows how to treat support, resistance and pivot levels.
This indicator shows 8 different lines (with possible additional lines) on the main chart and helps you to find the best entries and exit points.
You can download and use this indicator for MT4 and MT5.
Parameters and settings of Support and Resistance indicator
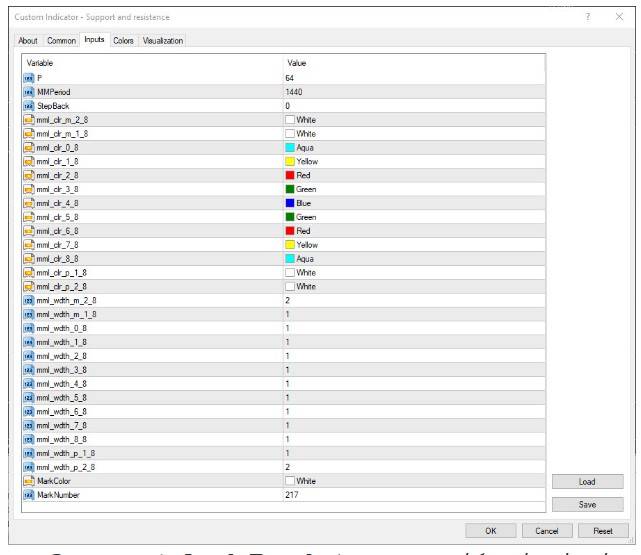
Support and Resistance indicator settings
P (Default = 64) – Period on bars or other periods on which lines are calculated.
We can say that lower the number, more accurate the calculations.
MMPeriod (default = 1440) – includes a time frame.
Per minute (60 – for hourly, 1440 – for daily, 10080 – for weekly and 43200 – for monthly)
If it is greater than zero, the indicator uses the P-value of the MMPeriod minute to calculate its lines.
If it is zero, the indicator uses the P value of the bars of the current chart to calculate its lines.
StepBack (default = 0) – Change the direction of the calculation of lines (in the current bars or the number of MMPeriod (if set) minutes).
Other parameters – Only affect the visual parameters of the lines on the chart.
In fact, other settings are used to adjust the colors of the lines on the chart.
Also in the numerical part, the following colors are used for the size of the lines.
Download Support and resistance indicator for MetaTrader 4
Download Support and Resistance indicator for MetaTrader 5
Guide to using the Support and Resistance Indicator
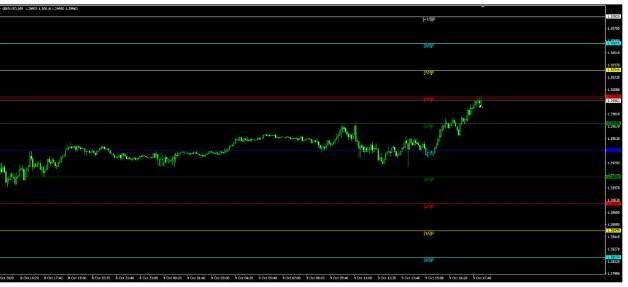
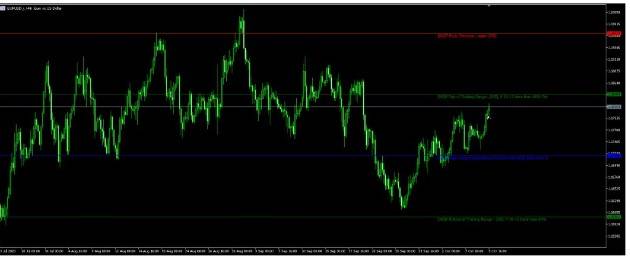
The Support and Resistance Indicator is quite easy to use.
The 0.8P and 8 / 8 P lines are the last resistance and support levels that are very difficult to break.
The 1 / 8P and 7 / 8P lines are weak support and resistance lines.
But if the price stops near them, it reverses and changes direction.
The 2 / 8P and 6 / 8P lines are strong reverse points.
3 / 8P and 5 / 8P are below and above the trading average, respectively.
It is very likely that the price will cross this range quickly or stay inside it for a long time.
4 / 8P is a major support and resistance line.
Sell or buy when the price passes through it for a taking a certain profit.
The blue arrow indicates the final calculated bar.
The indicator installation tutorial in MetaTrader 4
- To install the indicator in MetaTrader, first click on File from the top of the MetaTrader tab.
- Then select the Open Data Folder menu from the menu opened.
- Open the MQL4 folder to install the indicator
- And then copy and paste in the indicator folder.
- Now close your meta trader and open it again.
In the relevant menu you will see that the indicator has been added to your list of indicators.
Just double-click on it in MetaTrader so that you can call and place it on the chart.