
MFI indicator is known as one of the most useful Forex indicators.
MFI indicator has been one of the ten mostly used indicators for technical analysts in 2019 and 2020.
In this post, we will review and teach you how to use MFI indicator.

Topics of this post
What is an MFI indicator?
MFI stands for Money Flow Index.
MFI indicator shows the entering and exiting of money (liquidity) in the market.
The MFI indicator is used as a signal to confirm continuation of the trend or its reversal.
In some cases, MFI indicator is also used to determine buying and selling signal in the overbought/oversold markets.
MFI indicator is similar to RSI and MACD indicators in that they are classified as oscillators.
The difference between this indicator and RSI and MACD is that in MFI indicator, volume is also included in the calculations.
Hence it is also classified as volume indicators and this feature has made it so practical and hence popular amongst technical analysts.
while having many similarities with RSI oscillator, there is one important difference between the two and that is volume is also included in the calculations for MFI.
MFI indicator is scaled from 0 to 100 and the lines determine the market glut in buying or selling.
In other words, whenever MFI chart is above 80, it indicates overbought condition in the market and when it is below 20, it indicates oversold condition.
In such cases, because the trades are done irrationally, technical analysts try to buy below 20 and they try to sell above 80, hoping that the irrationality of the market will end and the market will reverse.
[adrotate banner=”16″]
How to install MFI indicator in MetaTrader
In your MetaTrader toolbar in the indicators section, find MFI indicator and click on it to run its settings.
If you are not seeing it, you can download the indicator from below:
In the first section, you can set the time intervals for MFI indicator to perform its calculations for that period.
Noteworthy, most technical analysts use a 14-day period for this indicator.
Note that in MFI indicator, the smaller the time period selected, the indicator more sensitive to the price movements and may send a buy or sell signal with the slightest swing in the market.
And this can increase the error rate of the issued signals, so you need to be very careful when choosing the period.
Also, larger the number of time periods, less sensitive the indicator will be to the extent that it does not pay much attention to fluctuations at all.
This slows down the speed of the response of this indicator to market movements and can also cause loss of trading opportunities for analysts.
According to most analysts who use this indicator, the best results can be obtained in a period of 14 days.
And the standard number for these settings is 14.
In the second section, you will see two options: tick and real. The REAL option is considered for the volume of trades, but the TICK option uses the number of volume in the calculations instead of the volume itself.
[adrotate banner=”15″]
Look at the picture below:
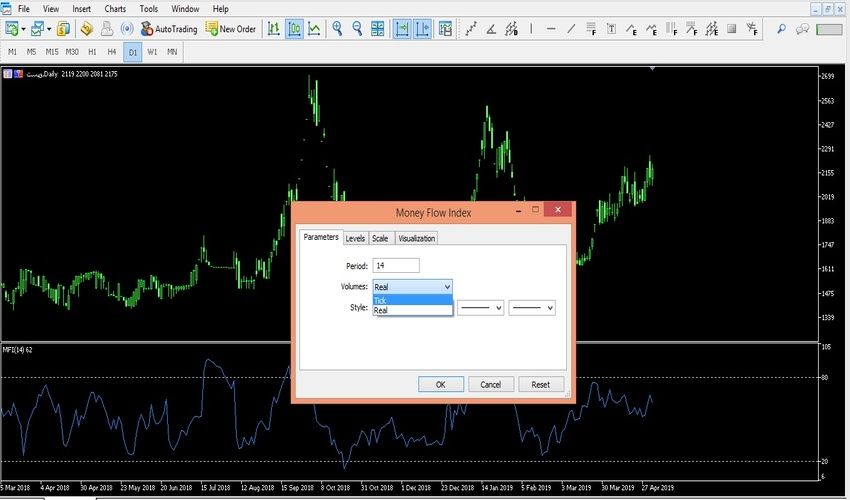
In the image above, as mentioned in the description, you can see MFI indicator settings page.
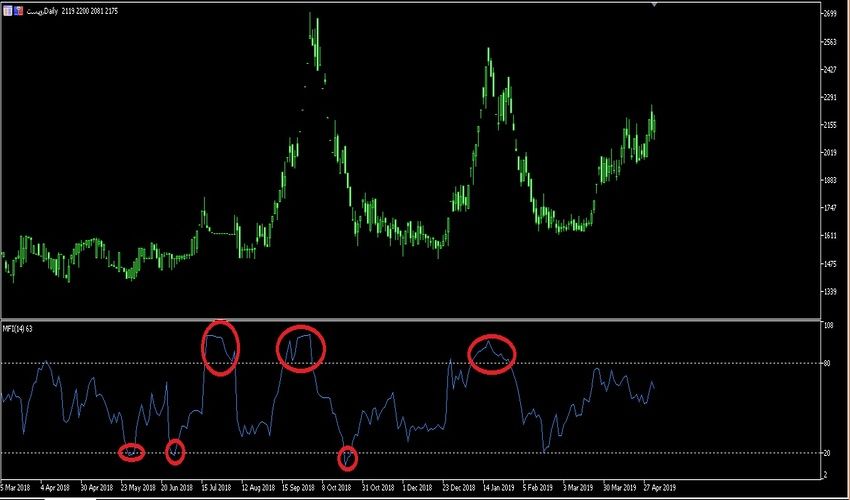
In the picture below, we see overbought and oversold zones in the market from the viewpoint of MFI indicator.
MFI Indicator Tutorial
If you look at the second image again, you will see that in some points, despite the fact that the indicator has provided buy or sell signals, the price did not reverse, in other words, it did not rise or fall much.
So once again we repeat what we repeated many times regarding all the indicators that No indicator should be used as a strategy on its own to enter and Exit the market.
In fact, different indicators should be used together to filter out errors provided by one another. A successful a technical analyst is a person who uses several tools together to have a better analysis.
For analysis, it is better that you analyze the market with several indicators together.
Also, fundamental analysis should be used alongside technical methods so that the result Achieved can be fruitful in the market with the least risk.
MFI indicator calculations
There are several steps in calculating the cash flow index or MFI indicator.
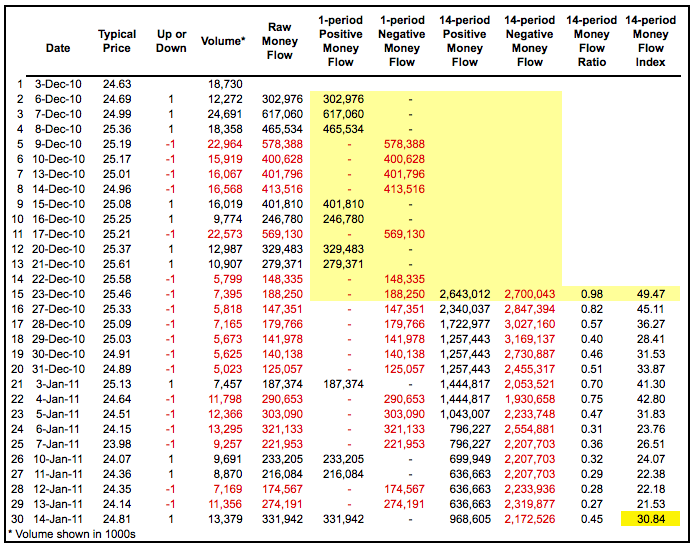
The following example is based on a 14-period cash flow index, which is the manufacturer’s suggested setting.
Normal price = (high price + low price + closing price of candlestick) / 3
Raw cash flow = normal price x volume
Cash flow ratio = (14-period positive cash flow) / (14-period negative cash flow)
Cash flow index = 100 – 100 / (1 + cash flow ratio)
First, note that the raw cash flow is essentially the volume of the dollar because the volume formula is multiplied by the usual price.
When ordinary money is transferred from one period to another, the raw cash flow (current flow) is positive and when the normal price decreases, it is negative.
Raw Money Flow values are not used if the usual price does not change.
The cash flow ratio in step 3 forms the basis of the cash flow index.
Positive and negative cash flows are collected for the return period (14) and the positive amount of positive money is divided to collect the negative ratio of negative cash flows.
The RSI formula is then applied to create a weighted index with volume. The table below shows an example of a calculation taken from an Excel spreadsheet.
Additional description of MFI indicator
As an RSI volume version, the Cash Flow Index (MFI) can be interpreted similarly to RSI.
The big difference, of course, is in the volume. As volume is added to the mix, the cash flow index will act slightly differently from the RSI.
Theories show that volume leads to price.
The RSI is a moving indicator that drives prices.
Quong and Soudack identified three key signals using the Cash Flow Index.
First, charters can look for excessive buy or sell levels to warn of price volatility, as discussed above.
Second, ascending and descending divergence can be used to predict the reverse trend.
Third, fluctuations in the 80s or 20s can also be used to detect possible price changes.
Identify oversold points with MFI indicator
Excessive buying and selling levels can be used to identify volatile price extremes.
Typically, the MFI indicator above 80 is over-bought and the MFI indicator below 20 is considered over-sold.
Strong trends can cause too much trouble for these classic levels of trading, or in other words, one can expect that a strong trend is ready to correct or return.
The MFI indicator can be bought too much (> 80) and when the uptrend is strong, prices can easily go higher.
Conversely, MFIs can be oversold (<20) and when the downtrend is strong, prices can easily go lower and continue their trend.
Moving above 90 is really buying too much and moving below 10 is really selling too much.
Moves above 90 and below 10 are rare events that indicate price movements are not stable.
Of course, many charts are traded for a long time, both in currency pairs and in stocks, without reaching the 10.90 level.
[adrotate banner=”14″]
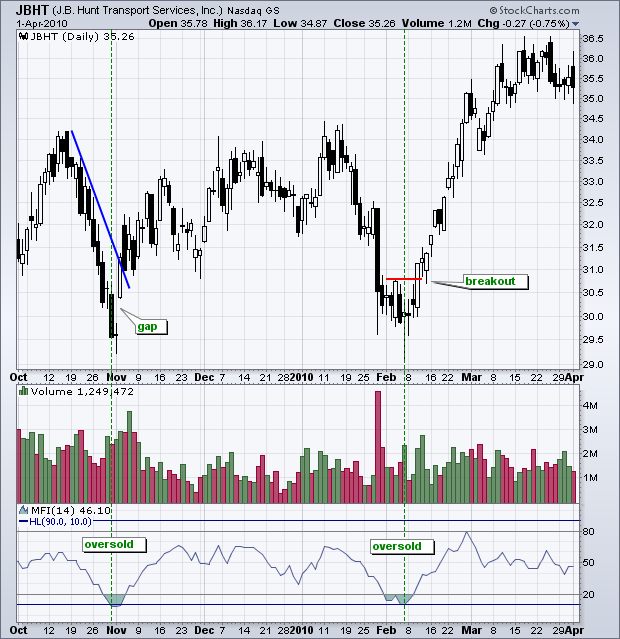
Pictured above is the JB Hunt (JBHT) chart with peak sales below 10 in late October 2009 and early February 2010, the Cash Flow Index (MFI Indicator) indicates overselling in the area.
The previous decline was strong enough to produce these readings, but the sell-offs show that these declines are not sustainable.
An over-sold level alone is not a sufficient reason to become bullish.
To confirm that prices have really become a corner, some kind of reversal or uptrend is needed.
JBHT well confirmed the first overselling gap by breaking the volume trend.
The stock confirmed the second volume of sales with the failure of volume resistance.
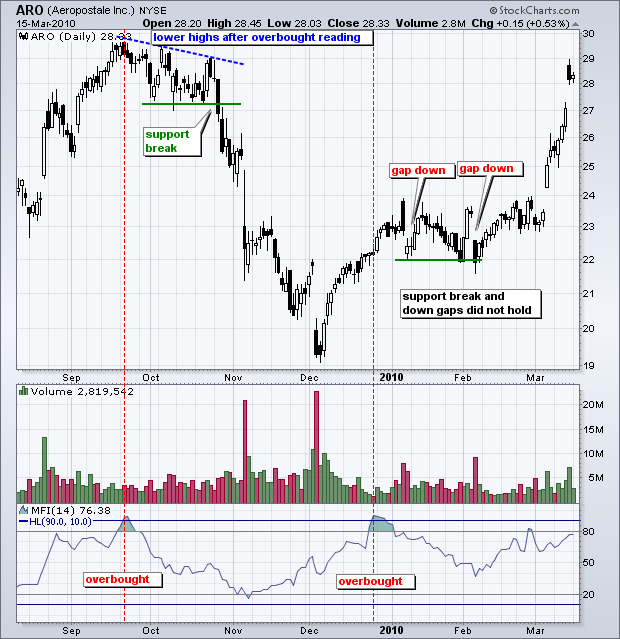
The Aeropostale (ARO) chart was formed with a turnover of over 90 in late September and late December 2009, which turned into a high cash flow.
Excessive purchases recorded in the MFI indicator indicate that these developments are not sustainable and a correction or change in the trend is imminent.
The first test and the formation of an oversupply led to a significant reduction, but the second case was not the right signal and did not cause a drop.
Note that the ARO peaked with the first oversupply and reached a lower peak in October.
The break in late October was a clear sign of a reversal.
After overbought in December, ARO moved above 23 and merged.
There were two downtrends and one support zone, but these areas were not maintained.
ARO eventually broke the resistance at 24 and reached the top 28.
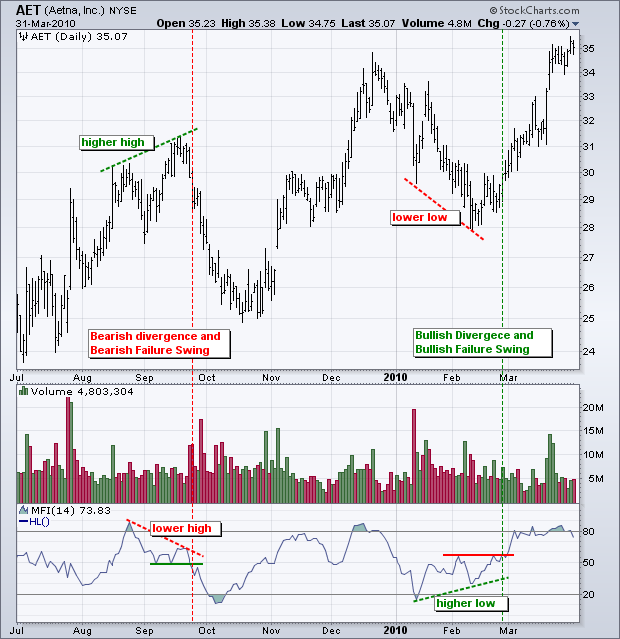
Divergences with MFI indicator
Another trading method with MFI indicator is to find market divergences for trades.
Earlier, it was said that RSI indicator is one of the most important tools for detecting divergences.
In this post, we want to tell you that the most important application of the MFI indicator is to find
Divergences as it warns us of a possible change in trend.
Look at the picture below:
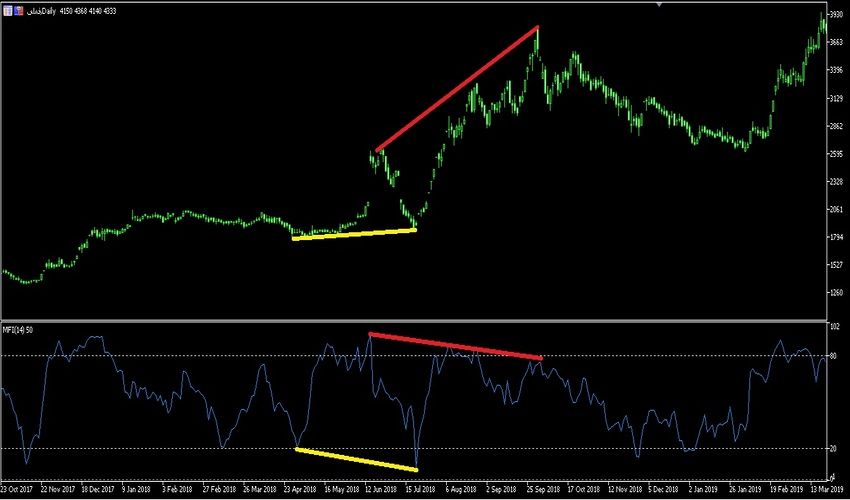
Formation of Divergence in a chart and the indicator indicates weakening the strength of the trend and perhaps a change in the direction.
Summary of MFI indicator
The Cash Flow Index (MFI) is a relatively unique index that combines movement and volume with the RSI formula.
The RSI will usually move above 50 when the market is trending up and below 50 when it is downtrending.
Even if the MFI is considered a weighted RSI, using the midfield to determine an uptrend or downtrend will not work at all.
Instead, the MFI will be used to detect possible price returns or market trends and even to detect market divergence.
It is important to note that using the MFI indicator alone to enter or exit trades is by no means the right thing to do.
You should use this Forex indicator along with other Forex indicators or your strategy, and of course you should be careful not to use indicators that do the same thing.
In a post, we have talked in detail about this with the title of multi-linear indicators. If you have not read it, be sure to click on the desired link at the end of this post, so that in this regard and multi-linear Forex indicators, necessary information and training. See enough.
In this training, examples of Iran Stock Exchange or Forex market and even stocks were given, so you should know that the use of this indicator in all these financial markets is very high.
If you have any questions about this educational post, ask them in the comments section, and we will answer them at the earliest opportunity.

Multicollinearity in Technical Analysis
Multilinearity is a statistical term that refers to the unintentional use of one type of information more than once.
This is a problem that is worryingly common in technical analysis.
Analysts should be careful not to use indicators that indicate one type of information.
This session of the secondary forex training course is one of several training sessions that you can access all of them from the opposite box.

اگر در بازار فارکس فعال هستید
حتما در وی شارژ یک حساب داشته باشید
Hey guys, I was reading through the MFI tutorial and got a bit confused about the ‘tick’ vs ‘real’ volume setting. The article says, ‘The REAL option is considered for the volume of trades, but the TICK option uses the number of volume in the calculations instead of the volume itself.’ What does ‘number of volume’ mean exactly if not the actual volume? Can someone explain the practical difference between these two when setting up MFI in MetaTrader?
That’s a super common and excellent question, and it really gets to the heart of how volume is interpreted in different market contexts, especially within MetaTrader.
When the article mentions “The REAL option is considered for the volume of trades,” it’s referring to the actual, aggregated amount of contracts or units traded during a specific time period. Think of it like this: if you’re trading stocks on an exchange, ‘real volume’ would be the total number of shares that changed hands. This data is usually precise and readily available from centralized exchanges. However, the Forex market is decentralized, meaning there isn’t one central exchange tracking every single trade globally. So, getting a true, consolidated “real volume” for all Forex transactions across all brokers is practically impossible for retail platforms.
This is where ‘Tick Volume’ comes into play, which is what MetaTrader primarily provides for Forex. When the article says “the TICK option uses the number of volume in the calculations instead of the volume itself,” it’s a slightly clunky way of saying it counts the number of price changes, or ‘ticks,’ that occur within a given period. It’s not measuring the size of the trades (e.g., how many lots were traded), but rather the frequency of price movements. So, if the EUR/USD price changes 100 times in a minute, the tick volume for that minute is 100, regardless of whether those changes were driven by small individual trades or large institutional orders. It acts as a proxy for market activity and liquidity; generally, higher tick volume suggests more market interest and participation.
So, for the built-in MFI indicator in MetaTrader, when you select ‘REAL,’ it typically defaults to using the tick volume data that the platform provides, because true ‘real volume’ isn’t available for Forex. The ‘Tick’ option explicitly uses this tick volume. The practical difference is that ‘real volume’ (if you could access it for Forex) would give you a direct measure of actual capital flow, while ‘tick volume’ gives you an indication of how active the market is. While tick volume is highly correlated with real volume, it’s an indirect measure. For most retail Forex traders using standard MT4/MT5, tick volume is the accessible and commonly used “volume” metric for indicators like MFI, and it can still be very effective in identifying potential momentum or reversals when interpreted correctly.