
The ATrend Indicator is one of the best and most useful indicators in Forex.
The main function of this indicator is to detect changes in direction of the trend and it shows it as an alarm on the chart.
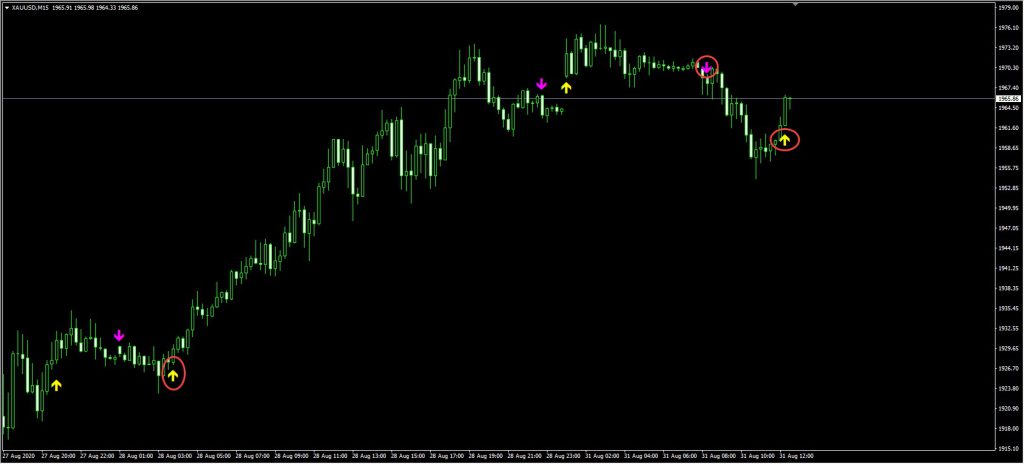
The ATrend indicator shows the new direction as it detects the trend by displaying an arrow on the chart.
Take a look at the image below (click to enlarge the image)
[adrotate banner=”16″]
ATrend Indicator Description
This indicator is a filtering indicator. An arrow may appear on your chart but after a while it will be removed from your chart. This means that the indicator has realized that there is an error in its diagnosis and that’s why the previous arrow was deleted.
Therefore, we must be careful to use it along with another strategy or other indicators to filter the signals issued.
To download this indicator, use the link below and then uncompress the file and copy the contents to the MetaTrader 4 indicator folder.
[adrotate banner=”15″]
Download Free ATrend Indicator
installation tutorial of the indicator in MetaTrader 4
How to install the indicator in MetaTrader 4? (tutorial)
⦁ To install the indicator in MetaTrader, first click on File from the top of the MetaTrader tab.
⦁ Then select the Open Data Folder menu from the menu openned
⦁ Open the MQL4 folder to install the indicator
⦁ And then copy and paste in the indicator folder.
⦁ Now close your meta trader and open it again.
In the relevant menu you will see that the indicator has been added to your list of indicators.
Just double-click on it in MetaTrader so that you can call and place it on the chart.
[adrotate banner=”14″]
So, the article says, ‘An arrow may appear on your chart but after a while it will be removed from your chart. This means that the indicator has realized that there is an error in its diagnosis and that&8217;s why the previous arrow was deleted. Therefore, we must be careful to use it along with another strategy or other indicators to filter the signals issued.’ This “repainting” thing sounds a bit tricky, like it’s changing its mind. How exactly are we supposed to combine it with other stuff to actually trust its signals? If it keeps deleting arrows, what’s the point of the initial signal?
That’s a really good observation and you’ve hit on a key characteristic of many dynamic indicators, especially those that adapt to market conditions. What you’re describing, where an arrow appears and then disappears, is commonly known as ‘repainting.’
Repainting happens when an indicator recalculates its historical values based on new price data. For ATrend, this means it’s constantly trying to refine its ‘diagnosis’ of the trend. If it initially sees a potential trend change and draws an arrow, but then subsequent price action contradicts that initial assessment, it will remove the arrow to reflect the updated understanding. The downside is exactly what you mentioned: it can make it hard to trust signals in real-time because what you see now might not be there later.
So, how do we use it effectively? The key is exactly what the article suggests: filtering. Think of the ATrend arrow as a ‘heads-up’ or a potential early warning, not a definitive entry signal. Here are a few ways to filter its signals:
1. Wait for Candle Close: This is probably the most important rule for repainting indicators. Never act on an arrow that appears on a candle that is still forming. Wait for the current candle to fully close. If the arrow is still there after the candle closes, it’s a more stable signal (though it can still repaint later based on even more data, but waiting for candle close significantly reduces false signals).
2. Combine with Trend-Following Indicators: Use the ATrend arrow only when a longer-term trend is confirmed by something else. For example, if you’re looking for a buy signal from ATrend, make sure price is above a 200-period Moving Average, or that a 50-period MA has crossed above a 100-period MA. This ensures you’re trading with the larger flow.
3. Confirm with Oscillators: Look for confirmation from indicators like RSI or Stochastic. If ATrend gives a buy arrow, check if RSI is moving up from oversold territory or if there’s a bullish divergence. For a sell arrow, look for overbought conditions or bearish divergence.
4. Price Action Confirmation: After an ATrend arrow appears (and ideally, after the candle closes), look for confirming price action. Is the arrow appearing at a key support/resistance level? Is there a strong bullish engulfing or pin bar candlestick pattern after a buy arrow, or a bearish one after a sell arrow?
5. Multi-Timeframe Analysis: If you get an ATrend signal on a lower timeframe (e.g., 15-minute chart), check if the higher timeframe (e.g., 1-hour or 4-hour chart) is showing a similar trend direction or is at a significant level that supports your trade direction. Don’t take a buy signal on the 15-minute if the 4-hour chart is clearly in a strong downtrend.
By using these filtering techniques, you’re essentially building a robust strategy around the ATrend indicator, using its early detection capabilities while mitigating the risks associated with its repainting nature. It’s about combining multiple pieces of evidence to increase your probability of a successful trade.
Hi, I’ve been looking into the ATrend Indicator. Is it generally considered a good leading or lagging indicator for identifying trend changes?
The ATrend Indicator, similar to most trend-following tools, is primarily considered a **lagging indicator**. Its strength lies in confirming the establishment and direction of a trend once it’s already underway, providing clear visual cues for trend identification and continuation. While excellent for confirmation, traders often pair it with other indicators, such as oscillators or price action analysis, to gain earlier insights into potential trend shifts or reversals. It’s important to understand how different indicators complement each other in your trading strategy.
Please note, TejaratFX is an educational and review platform, not a financial advisor or a broker. We encourage all users to conduct thorough research and understand the risks involved in trading.
Hey, I’ve been seeing some buzz about the ATrend Indicator. Is it really as good as people say for spotting trends and reversals?
Hi, I was looking at your content and saw the ATrend Indicator mentioned. How effective is it for spotting trends, and do you have any tips on the best way to integrate it into a trading strategy?
Hello! The ATrend Indicator is generally designed to assist traders in identifying the direction and potential strength of market trends. While it can be a valuable tool for spotting trends, its effectiveness is often enhanced when used in conjunction with other technical analysis tools and confirmation signals. We recommend thorough backtesting and integrating it into a well-defined trading plan that suits your individual style and risk tolerance. As an educational and review platform, TejaratFX focuses on providing insights and analysis, and we do not offer brokerage services or financial advice.
Hey there, I saw your article on the ATrend Indicator. What’s the main idea behind it, like, how does it help with identifying trends?
The ATrend Indicator is designed to help traders identify the prevailing market trend direction and strength by smoothing out price action. It typically uses an algorithm to determine whether the market is in an uptrend, downtrend, or ranging phase, often visually represented by color changes or line direction. This can assist in confirming entries or exits, or simply understanding market momentum. Please remember, as an educational platform, TejaratFX provides insights and reviews; we do not offer financial advice or brokerage services.
Hi, great info on the ATrend Indicator. Is it generally better suited for scalping or more for swing/position trading?
Thanks for your question about the ATrend Indicator. It’s quite versatile and can be applied to both scalping and longer-term strategies, depending on your chosen timeframe and specific settings. For scalping, you might use it on lower timeframes with tighter parameters, while for longer-term trades, higher timeframes with smoother settings would be more appropriate to identify broader trends. We always recommend thorough backtesting and practice to determine the optimal use for your personal trading style. As an educational and review platform, TejaratFX does not provide financial advice or brokerage services.