

In this post, we will introduce you an indicator called the Strongest Pivot Points Indicator and we have prepared the file (Strongest Pivot Points Indicator) so that you can download it freely. so enjoy!
Please be noted that this is really the strongest indicator of Pivot Points in MetaTrader version 4. And the version of indicator for MetaTrader 5 is different.
If you wish to know more about the strongest Pivot Points indicator and the Pivot Points, what a pivot point is and how it is calculated, stay with us.
Best Pivot Point Indicator mt4
Let’s start by downloading the Strongest Pivot Points Indicator file:
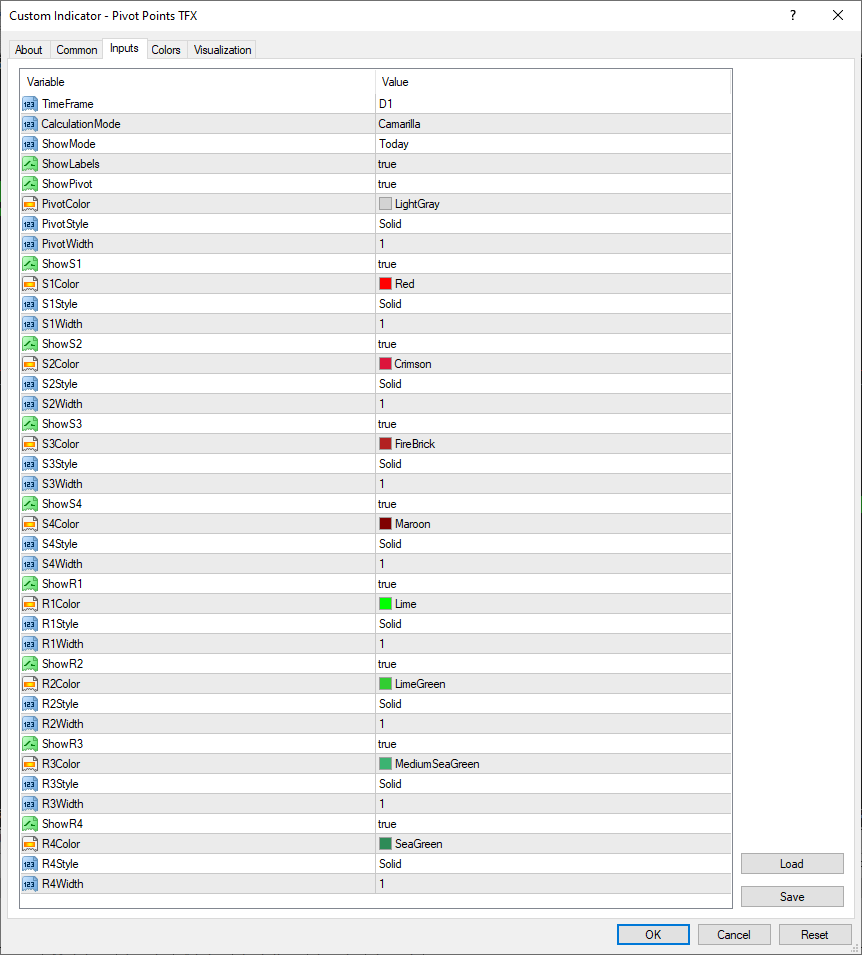
The image above is a part of the PivotPoint indicator settings.
The MetaTrader 4 version of the Pivot Point indicator is the strongest and most complete Pivot point indicator available.
Best Pivot Point Indicator mt5
Here is PivotPoint indicator for MT5:
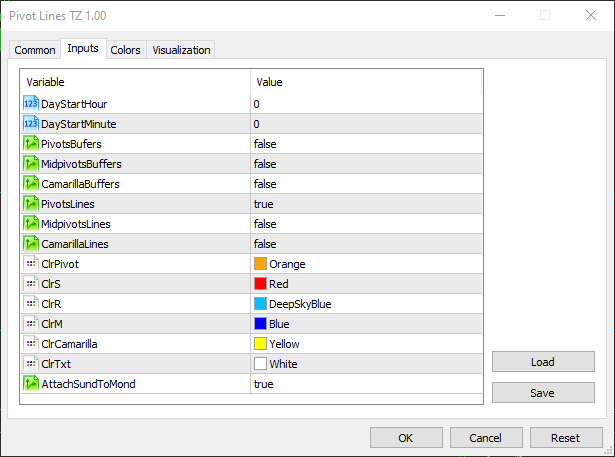
Pivot Points Mt5 indicator may not the strongest indicator of Pivot Point to display the pivot levels. But it is still for sure one of the strongest indicators of Pivot Point in MetaTrader 5.
This version of the indicator may not have the accuracy of the indicator for MetaTrader 4, But it is definitely useful for displaying Pivot Point in MetaTrader 5.
Now let us explain the pivot principles:
Even if you are familiar with pivots, continue to read this post since you will discover and learn the things you may not have seen anywhere else.
even if you have seen, you have just ignored them! But if you wish to get the best results from pivot points, stay with us.
What are Pivot Points?
- if the price of a currency pair or asset moves above the pivot area, then the result will be an upward trend, so we should look for the signals to buy the trend and ignore any signal for selling.
- If the price of a currency pair moves below the pivot point, then it indicates a downtrend. So we have to ignore the buy signals and look for the sell signals in the Forex market.
- In the strongest indicator for Pivot Points Mt4 you will notice that 4 more levels are displayed including S1 to S4 for support points and R1 to R4 for resistance points which are very important and worthy.
- In the additional specified levels in the strongest indicator Pivot Points Mt4, the trend may be reversed and of course they can also confirm the continuation of the current market trend. Imagine that the price is falling and moving below the S1, So the downtrend is confirmed and indicate that the price is likely to continue to decline to S2.
Formula to calculate pivot points:
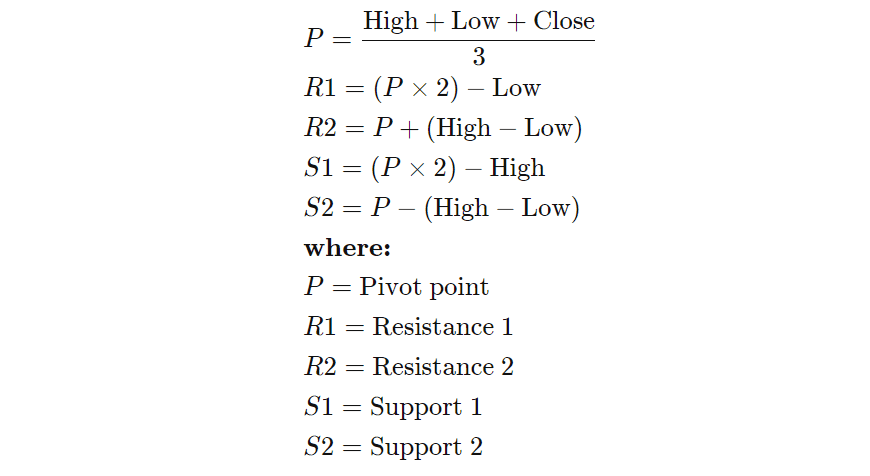
Of course what you should note from the beginning is that you are using the strongest Pivot Points Indicator for MetaTrader 4 or Pivot Points Mt5 indicator for MetaTrader 5. You do not need to calculate these points manually and the Forex indicator calculates it for you but still, knowing this formula can be pleasing.
In the formula above:
High: represents the highest price recorded in the previous day.
Low: represents the lowest price recorded in the previous day.
Close: indicates the price closed the day before.
How to calculate pivot points?
Well, knowing the above mentioned things, the question is How do we calculate pivot points in our manual method?
Again, we emphasize that Pivot Points Mt4 indicator can be added to the chart. This indicator automatically calculates and displays these levels.
But we here teach you how to manually calculate these points.
All you need to do is to follow 4 steps:
- After the market closes or before it opens the next day, it is enough to find the high price, the low price and the closing price.
- Now add these prices together and divide by 3 to reach the average.
- Mark the price obtained on the chart and, insert P next to it (just as an example).
- Now it is enough to calculate the points S1 to S4. And done.
note that (HIGH and LOW) in these calculations must be done according to the previous day. draw them all on the chart and enjoy them.
Traders, especially day traders, use pivot points a lot.
If this morning is Tuesday, use the high, low and closing price of Monday to get today’s pivot points.
Now we talk about how to calculate each of these levels.
First we need to calculate the pivot point (PP) that is in the middle of the other lines.
Calculate the base pivot (PP)
Below, you can see the formula for calculating the basic pivot point level.
(PP) pivot point = (High + Low + Close) / 3
Calculate pivots R1, R2, S1, S2
Now that we have learned how to calculate the pivot point (PP), we can calculate the pivot levels R1, R2, S1, S2 as follows.
R1 = (2 * PP) – Low
R2 = PP + (High – Low)
S1 = (2 * PP) – High
S2 = PP – (High – Low)
How to Calculate pivot levels R3 and S3?
R3 = High + 2 * (PP – Low)
S3 = Low – 2 * (High – PP)
As you can see, in calculating all pivot levels, there is a basic pivot value (PP). This is because the basic pivot level is critical for all pivot points. Therefore, you need to be careful when calculating the basic pivot (PP) level.
hence, if you miscalculate this level, other calculations will also be not valid.
We won’t continue this calculations discussion anymore because, as we said The strongest indicator Pivot Points Mt4 will calculate these things very well for you. But If you want to calculate it manually, you can use the formula mentioned above for this.
Different types of Pivot Points
There are different types of pivot points. today, we will discuss the 5 most popular types of pivot points. Of course, we cover others types too, but what is more important to us is the 5 types we are going to talk about them today alongside with the explanation of how to apply them.
Standard Pivot Point
One of the basic pivot points that day traders use is the standard pivot point.
Traders start with a basic (PP) pivot Which is the average of the high, low and closing price of the previous period.
In standard pivot points, PP, R1, R2, S1, S2 are calculated normally.
(PP) = (High + Low + Close) /3
R1 = (2*PP) – Low
R2 = PP + (High – Low)
S1 = (2 * PP) – High
S2 = PP – (High – Low)
Fibonacci Pivot Point
Fibonacci Pivot point is almost the most popular type of pivot points. Fibonacci expansion levels and Fibonacci retracement levels are being Used in Forex market as well as in the stock market. The main Fibonacci levels that most traders observe are the retrace levels of 38.2% and 61.8%.
Below, you can see how to calculate Fibonacci point points.
Woodie Pivot Point
In this type of pivot point, what has the most weight is the last price (closing price).
The Woodie Pivot Pivot formula for determining support and resistance levels is as follows.
Pivot Point Camarilla
Another type of pivot used by traders is the Camarilla Pivot Point. In fact, this type of pivot point is one of the most professional types of pivot points. In the strongest Pivot Points Mt4 indicator you can plot this kind of pivot point from the drop-down menu designed to change the different types of pivots. After doing so the indicator automatically calculates this pivot for you.
Nick Scott was the first who invented this type of pivot in the 1980s. Unlike Woodie Pivot point which has 2 support levels and 2 resistance levels, this pivot point has 4 support levels and 4 resistance levels.
Camarilla calculations are as follows:
Demark Pivot Point
In this pivot point, the first (Open) and last (Close) prices have separate relations. the famous trader, called Tom Demark, was first who introduced this pivot point.
Support and resistance levels in Demark Pivot Point are calculated using the number X. This method relies price actions. The calculations are as follows:
So if you are to spot pivots that to understand whether also confirm with Price Action, you should use the Demark Pivot type. It should be noted that since you are using the strongest indicator Pivot Points Mt4, you do not need these points for Pivot Demark and you can simply have it on the chart by placing the calculation method and displaying method in the strongest Pivot Points Mt4 indicator.
What do pivot points tell us?
What is often used in futures, commodities and the stock market, is the daily pivot indicator. Unlike moving averages or oscillators, pivot points remain fixed throughout the day. This means that traders can use its levels for trading strategies.
For example, traders know that if the price moves below the pivot point, they should probably sell soon, and if the price moves above these points, they should buy soon.
Levels S1, S2, R1 and R2 can be used as targets for these trades; what we mean by target is as stop loss and take profit.
Traders can also find enter and exit points by using these points.
Combining pivot points with other trend (directional) indicators can also be a good practice for traders; If you use a moving average 50 or 200, the pivot points can have a cross over or convergence on each other.
The combination of pivot points with extension Fibonacci also offers much stronger levels of resistance and support.
The difference between Pivot Points and Fibonacci Retracement
In fact, points like Pivots or Fibonacci (Extension) both have horizontal lines which cause the support and resistance points and areas be shown on the chart.
Fibonacci Retracement levels have the power to be spot on the chart with any price. After being calculated, these lines should be placed on the selected range as a percentage.
Pivot points (pivot levels) do not use percentage, but they work based on fixed numbers: The highest price, the lowest price, the closing price of the day before! As simple as that.
When we attain the pivot points, it is like we get a virtual resistance and a support level. This means that we expect that most price movements will occur in this range.
Other levels of resistance and support is no longer much credible, but it is still possible that we can use them to detect price action hence they will be useful for us.
There are two general ways to use pivot points:
- detecting direction of the trend that we discussed above.
- detecting points and levels to enter the market or exit a trade.
Let’s say a trader wants to place a Limited order so that if virtual resistance level 200 broken, starts to buy. so you can place a stop loss in the same support range so that in case of reaching it, our open trade (which is in the opposite direction) is closed.
Another use of these levels is to predict future price action, although sometimes they have little effect.
The success rate of using pivot points depends only on the strength and ability of the trader using in combination with other indicators.
These necessary indicators are not a specific indicator. It could be MACD, RSI or it may not be even an indicator. We can even use candle stick formations.
All is needed is that their signals are more similar to each other, so by confirming each other, they can have a higher success rate.
As we have always said, we should not rely on and analyze the situation just by one indicator.
To improve the performance of any strategy or indicator, they should be used together with pivot points. This allows us to better measure the strength of the trend and hence trade in the right direction.
Another thing to keep in mind that should be followed is that you should not enter the market by testing of a certain level or a pivot point for the first time. Be patient and use them alongside other strategies or indicators.
Rules of a Forex Strategy Using the Strongest Pivot Points Mt4 Indicator
Let’s say we want to design a strategy by combining the Pivot Point indicator with another indicator.
Let’s write the rules of this system together:
- A) If SMA 50 goes upwards, just open a buy position.
- B) If SMA 50 is down, just open a sell position.
- If the price is reversed by reaching the pivot level, wait that it is repeated for the second time that the validity of that level be confirmed.
People who are interested in day trading prefer to use 5 to 30 minute charts and swing traders make the most use of weekly pivot points.
These kind of traders are very interested in h1 to daily charts, and there is another group that uses monthly pivots so they pick daily and weekly charts and then use them to analyze and trading.
You have probably come to the conclusion that pivot points and the use of a pivot-based trading system and using pivot points should be very easy and at the same time very effective and useful. But believe us, this is not the case. It may look simple, but it really requires a lot of focus and experience.
You have solved a large part of the calculations with the Strongest Indicator Pivot Points Mt4, but still it requires need experience and improvement to get the best result.
However, by using the strongest indicator Pivot Points Mt4, you can start trading if the market is not range bound.
And if the market is in range bound condition, you should stop working with this indicator and manage the situation if you have an open position.
Time sessions and their relation with Pivot Points
Another thing you should know is that pivot points are sensitive to time sessions. Most pivot points are interesting to be noticed when the markets close in New York or London.
So if someone is using their MetaTrader in another time session such as San Francisco or Tokyo, they will certainly see pivot points different from other people at other times zones.
It is even possible that the pivot points of such people are not much valuable to be noticed in global markets.
In fact, we value just the pivots recorded in the New York and London time zones.
So we suggest that you set your MetaTrader based on New York or London time. Because both regions are set based on the global time or named GMT.
Traders use pivot points regularly with fixed proportions.
In fact, if they trade in a monthly time frame, then they calculate the previous month’s pivot points and if they use weekly chart, they calculate the pivot points of the previous week and the rest. at each time frame, the pivot is calculated and used for the same time frame.
Of course, we suggest you to use daily pivots too for less than daily timeframes.
How to calculate tomorrows pivot points?
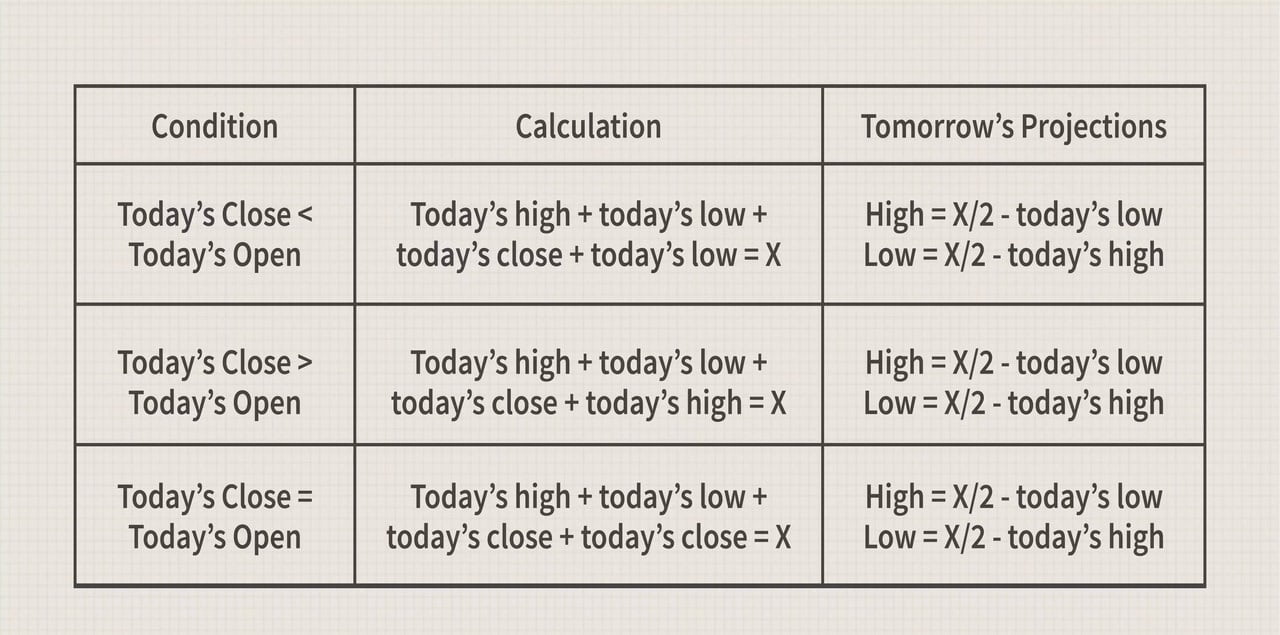
You can follow the formula mentioned above to have tomorrow’s pivot points:
In this image if: Today’s closing is less than the opening:
calculation:
Today High + Today Low + Today Closing + Today Low = X
Tomorrow’s forecast:
X= High/2 – today’s low
X= Low /2 – today’s high
If: today Closing is higher than the opening:
calculation:
Today High + Today Low + Today Closing + Today High = X
Tomorrow forecast:
X= high/2 – today’s low
X= Low/2 – today’s high
If: today closing equals the opening:
calculation:
Today High + Today Low + Today Closing + Today Closing = X
Tomorrow’s forecast:
X= High/2 – today’s low
X= Low/2 – today’s high
Combination of pivot points and indicators
As we have said lots of times, it is not a right thing at all to take a position using just an indicator solely.
We have always suggested that you should use each indicator along with other indicators, because by doing this you can filter errors by several indicators or one indicator alongside another strategy and you get the best results.
You can combine the Pivot Point indicator with other indicators so that by this they can filter each other’s flaws.
For example, if you filter the RSI divergence signals with the Pivot Point indicator, it will help you to avoid taking positions on wrong divergences.
Or, for example, if you try to filter the enter signals that you find with the ALL MACD indicator, with the strongest indicator Pivot Points, it will definitely reduce errors again.
What we have to do is very simple, we have to only take position based on the signals we receive when all the indicators confirm each other.
Summary
Given that pivot points are achieved based on simple calculations, it is considered suitable for some and not suitable for others.
But what you need to know is that there is no certainty as to where the price stops, or where it will change the direction and move in the opposite direction or in other words when the so-called reversal of the trend will happen. There is also no certainty whether the specific levels will react.
So, as we mentioned many times in this post, Pivot points must be also part of each person’s strategy, and should be used alongside with other indicators, and not all alone.
In other words, no indicator will function correctly solely on its own and it must be used together with other Indicators.
Strongest Pivot Points Indicator also of no exception.
OMG, this article just blew my mind! Seriously, I’ve been trying to figure out pivot points for a while now, and I thought I had a basic grasp, but this whole thing about the ‘Strongest Pivot Points Indicator’ for MT4 is just next level. I downloaded it right away, and wow, it’s so much more than I expected!
The part that really hit me, like a total lightbulb moment, was when you talked about how this indicator shows four more levels – S1 to S4 for support and R1 to R4 for resistance. I always thought it was just R1 and S1, maybe R2 and S2 if I was lucky! This is like finding hidden treasure on my charts.
So, here’s my super excited question: How exactly do we use these additional S2, S3, S4 and R2, R3, R4 levels in real trading? The article says they can confirm a trend or even indicate a reversal, which sounds incredibly powerful. Can you give me some practical examples of what to look for?
I mean, if the price drops below S1 and then keeps going towards S2, does that mean the downtrend is super strong and I should double down on my sell? Or if it bounces off R3, is that a guaranteed reversal signal? I’m trying to wrap my head around the ‘how-to’ for these specific extended levels.
This is such a game-changer for me as a new trader, and knowing how to properly interpret and act on these deeper support and resistance zones from your ‘strongest’ indicator would be amazing. Any real-world tips would be seriously appreciated!
That’s fantastic to hear you’re finding the insights on pivot points and our Strongest Pivot Points Indicator so valuable! It’s exactly this kind of ‘lightbulb moment’ that makes learning about technical analysis so rewarding, especially when you discover the deeper layers of information available. You’ve hit on a really crucial aspect of using advanced pivot point indicators.
You’re absolutely right, while R1 and S1 are often the first levels traders encounter, the extended S2, S3, S4 and R2, R3, R4 levels offered by comprehensive indicators like the one we’ve shared, provide a much richer context for market behavior. Think of them as increasingly strong ‘zones of interest’ rather than just single lines. The farther out you go from the central pivot (PP), the more significant these levels can become for identifying potential trend strength or exhaustion.
Let’s break down how to interpret these:
For Trend Confirmation:
If the price breaks cleanly below S1 and then continues to move towards S2, this indeed suggests a strengthening downtrend. The article’s example of price falling below S1 indicating a likely decline to S2 is spot on. If it then breaks S2 and heads towards S3, it’s a further confirmation of bearish momentum. Each subsequent break of a support level (S1 -> S2 -> S3 -> S4) reinforces the existing trend, indicating that sellers are firmly in control and the downtrend is likely to persist. Conversely, for an uptrend, breaking R1 and then moving towards R2, R3, and R4 would confirm bullish momentum, showing buyers are dominant.
For Potential Reversals:
These outer levels (S3, S4, R3, R4) are particularly interesting for potential reversals, but they require careful observation. If the price reaches S3 or S4 after a significant downtrend, especially with accompanying signs of seller exhaustion (like decreasing volume, divergence on an oscillator, or candlestick reversal patterns), it can signal that the downtrend is overextended and a bounce or reversal might be imminent. It’s not a ‘guaranteed’ reversal, but rather a high-probability area where smart money might look to take profits or even initiate counter-trend trades. Similarly, reaching R3 or R4 after a strong uptrend could suggest that buyers are exhausted, and a pullback or reversal to the downside is becoming more likely. You’d look for similar confirmatory signals here.
Practical Examples:
Downtrend Confirmation: Imagine the price opens, dips below PP, breaks S1 with a strong bearish candle, and then continues to fall towards S2. This confirms the bearish sentiment. If it hits S2, consolidates briefly, and then breaks S2 with another strong move, you’d look for targets around S3. Your initial sell might be extended, or you might look for further sell entries on pullbacks to the broken S2 level.
Uptrend Reversal from R3: Price has been in a strong uptrend, pushing past R1 and R2. It reaches R3, and instead of breaking through, you see long upper wicks on candles, a bearish engulfing pattern, and perhaps the RSI indicator showing overbought conditions and starting to turn down. This confluence of signals around R3 could be a good indication to consider taking profits on long positions or even looking for a short entry with a tight stop-loss above R3.
Remember, no single indicator or level works in isolation. The power of these extended pivot levels comes from using them in conjunction with other technical analysis tools like candlestick patterns, volume, and other indicators (e.g., MACD, RSI). Always consider the overall market context, news events, and your specific trading strategy. And crucially, always practice with a demo account first to get a feel for how these levels behave in different market conditions before applying them to live trading.
Keep exploring and asking questions – that’s the best way to master these concepts!
Hey, I’m trying to find the best pivot point indicator for MT4. Do you have any suggestions or specific indicators you recommend looking into?
Finding the ‘best’ indicator often depends on your specific trading strategy, but for MT4, many traders look for indicators that automatically plot daily, weekly, or even monthly pivot points. Key features to consider include the ability to choose different calculation methods (e.g., Standard, Fibonacci, Camarilla, Woodie) and customizable visual display options. We offer educational resources and reviews to help you understand the nuances of various indicators and how to integrate them effectively into your trading plan.
Hey, thanks for the article on pivot points. I’m trying to find a good one for MT4. Which pivot point indicator do you guys personally recommend that’s reliable and easy to set up?
Hello! We’re glad you found our content helpful. For MT4, many traders utilize the standard Pivot Point indicator that’s often built-in or readily available. Custom indicators like ‘Auto Pivot Plotter’ or ‘Daily Pivot Points’ are also very popular for their additional features and ease of use. The ‘best’ often comes down to personal preference and how it integrates with your specific trading strategy, so we encourage you to try a few. Please remember, TejaratFX is an educational and review platform, and we do not provide direct trading advice or brokerage services.
Hi there, I’m trying to find the best pivot point indicator for MT4. There are so many out there! Do you have any recommendations or advice on what to look for?
Choosing the ‘best’ pivot point indicator for MT4 often comes down to your personal trading strategy and preferences. While there isn’t a single ‘best’ option for everyone, we recommend looking for indicators that offer flexibility in pivot calculation methods (e.g., standard, Fibonacci, Camarilla) and clear visualization on your charts. Many free and paid options are available on the MQL5 marketplace; testing a few different ones in a demo environment is a great way to find what works for you. Remember, TejaratFX is an educational and review platform, not a broker, and we always advise conducting your own due diligence on any trading tools or strategies.
why is the r3 and s3 off it doesn’t look like is in the right place