
This indicator studies and shows the power of buyers to seller. This indicator combines several indicators to study the power of buyers to sellers.
Based on the data obtained from each of the indicators, a signal is issued and respecting the average sum of these signals, this indicator creates a buy or sell signal.
Look at the image below
The indicators embedded in this indicator include:
⦁ Stochastic Oscillators
⦁ Moving Averages
⦁ MACD
⦁ ma Xvalues
⦁ Parabolic SAR
In this indicator, you can combine any of the inner indicators in the settings section.
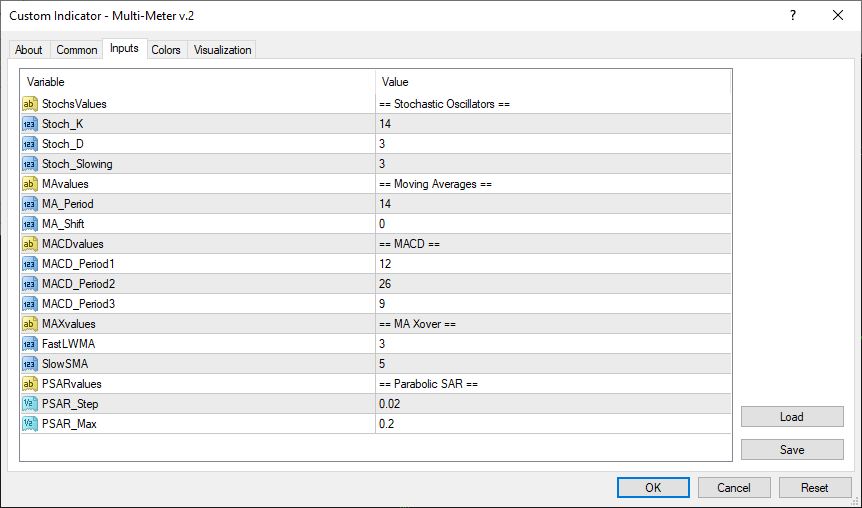
As you can see in the image above, you can set and apply your own version of configurations in the settings section of this indicator.
obviously Before doing so, you should get familiar with the way each of the inner indicators works.
So if you do not have any information about how each of those indicators works, you should take a look at “Indicators Section” of our website to find required information about them. We have made all the information available regarding the indicators for you.
Download Multi Meter Indicator
How the Multi-Meter Indicator Works?
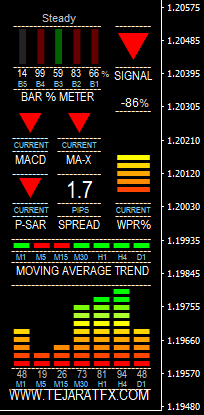
The Multi-Meter indicator draws a graph of the oscillators in timeframes from M1 to D1.
The Multi-Meter indicator also draws the market trend using the EMA indicator in the timeframe from M1 to D1.
The Multi-Meter indicator specifies the direction of MACD in the current chart, and also alarm when it crosses the signal line and the zero line.
The Multi-Meter indicator considers a fast LWMA for 3 periods and a 5-year SMA period (periods can be changed).
The Multi-Meter indicator considers the Parabolic SAR direction in the current chart to issue an exit signal as well as it confirms the enter signal.
Bar٪ Increase / Decrease Meter: These two sections are to provide a clear picture of the increase or decrease of the current price percentage relative to 4 bars.
In this method, although it is simple, but it is also effective. The fact is that the previous 4 movements (close to close) have an average and percentage, so if the current bar rises above 100%, its speed is higher than the last average, if its diameter is less than 100%, then it is likely to decrease.
In the Multi-Meter indicator, severe price movements are displayed in red or light green with different shades depending on the strength of the movement.
Of course, we emphasize again that this indicator is a combination of several indicators and since it tries to filter inputs and outputs, it is better to use it as a complement to your personal strategy.
How to work with Multi Meter Indicator Buyer Power to seller?
As we have explained, the idea and the average of several indicators can be achieved by this indicator on the current market trends and the strength of buyers to sellers to detect downtrend or uptrend.
You may see the market trend clearly using your eye, but to be certain and having a better result is using several different indicators given the ratio of buyers to sellers and averaging.
Well, let’s now talk a little bit about the impact of the buyer-seller ratio so we can better understand Why is it important to know if buyers have more power in the market or sellers!
Stay with us.
Ratio of Buyers to Sellers
studying the ratio of buyers to sellers is one of the most important points and it’s very important that we get acquainted with it in the market psychology section.
If you do not have any information in this regard, then be sure to read the relevant articles in the market psychology sections.
By the correct comparison and studying of the amount of buyers to sellers in a currency pair or in an index, we can get the right buy or sell signal that is close to the opinion of the majority of people in the market and find the general idea of the public and ride the trend with them.
Studying the number of buyers or number of sellers can provide us important information about the future of the market. By this, you will have a better understanding of the profitability of using the buyer-to-seller ratio study.
Buy Signal Using the Ratio of Buyers and Sellers
In this way we are actually studying the market and we enter the market using this method at the perfect time based on the number of buyers and sellers.
So when the number of buyers is less than sellers, we receive a sell signal in an instrument and we enter the market with a sell order.
Conversely, when the number of buyers is more than the sellers, we will have a buy signal.
[adrotate banner=”14″]
How to apply Multi Meter Indicator of Buyer Power to Seller
This indicator does all these calculations automatically for you and of course, it tries to reduce the error rate by getting the average.
So just download this indicator and enjoy it.
But remember a very important point:
This indicator, like other indicators, has little worth by its own. So you should use this indicator along with other Forex Indicators or use it with other Forex strategies to filter them.
Hi, great article on the Multi Meter Indicator! It sounds really powerful. Do you recommend using it on its own, or is it best paired with other indicators for confirmation?
The Multi Meter Indicator, like most analytical tools, generally performs best when used in conjunction with other confirming indicators or price action analysis. Relying solely on a single indicator can increase risk. We recommend combining it with tools that provide confluence, such as support/resistance levels, trend lines, or a complementary oscillator, and always backtesting any strategy thoroughly. Please remember, TejaratFX is an educational and review platform, not a financial advisor or broker.