
Bollinger Band Stops Indicator (The new version 2020) is one of the most popular indicators among the traders.
this indicator is used mainly to determine the trend direction and detect the exit points in the trade.
There are various settings in the Bollinger Band Stops indicator, the most important of which is; it allows the user to call this indicator for the higher time frames in the chart.
look at the image below (click on the image to enlarge it).
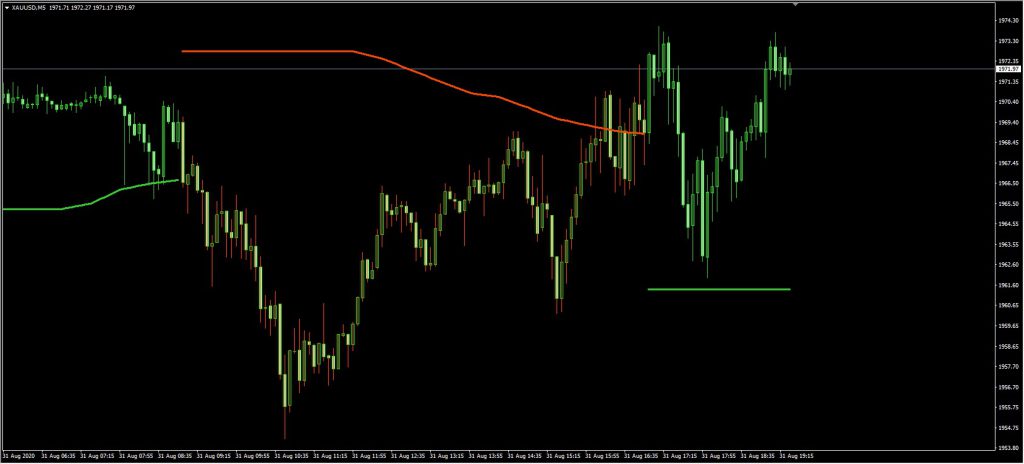
In the image above, we have the chart of Gold in 5 min time frame but the indicator on this chart has been called for 30 min time frame.
Look at another image (click on it to enlarge)
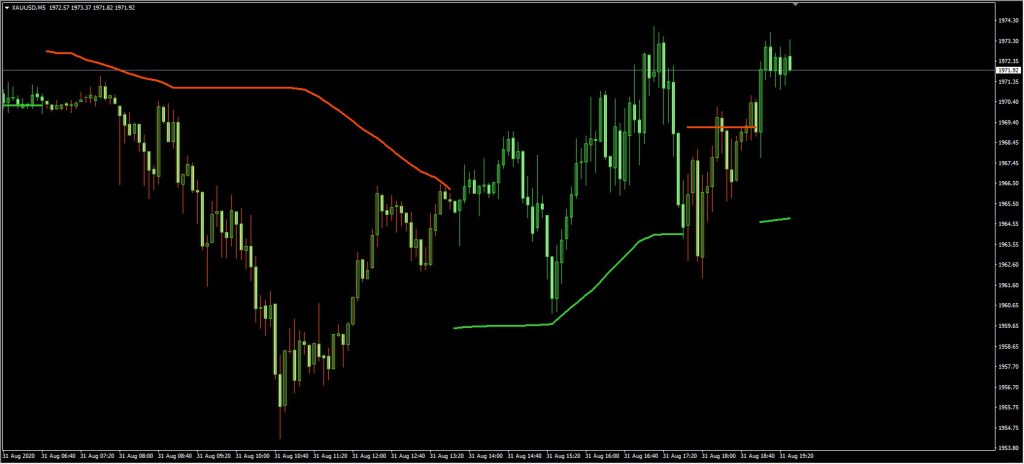
In this image, we are seeing the same chart by calling it this time for 15 min time frame.
How to determine SL with the Bollinger Band Stops indicator?
Imagine you determine the enter points based on your strategy but you have trouble determining the exit points and especially your stop loss.
you can have the price range for exit points by using this indicator.
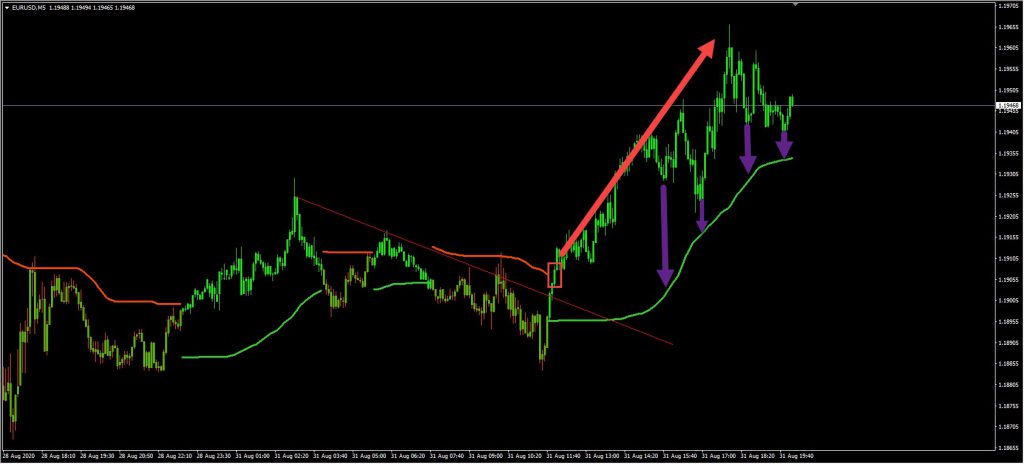
Take a look at the image below (click on the image to enlarge it).
In the image above, based on the strategy of breakout of the trend line we have a perfect buy position, and assuming that we have entered the specified point, one way to determine the SL is breaking and changing the color of the green line in this Forex indicator to red, which is marked by purple arrows in the image above.
pay attention to the image below (click on it to enlarge it).
Download Bollinger Band Stops Indicator
You can download this indicator here for free
Be sure to note that in no case can any indicator be used alone to enter or exit a trade. In other words, you should definitely use these indicators to filter your strategy.
installation tutorial of the indicator in MetaTrader 4
How to install the indicator in MetaTrader 4? (tutorial)
⦁ To install the indicator in MetaTrader, first click on File from the top of the MetaTrader tab.
⦁ Then select the Open Data Folder menu from the menu openned
⦁ Open the MQL4 folder to install the indicator
⦁ And then copy and paste in the indicator folder.
⦁ Now close your meta trader and open it again.
In the relevant menu you will see that the indicator has been added to your list of indicators.
Just double-click on it in MetaTrader so that you can call and place it on the chart.
بله، دقیقا نکتهای که بهش اشاره کردید یکی از مزیتهای کلیدی این ورژن جدید از اندیکاتور Bollinger Band Stops هست. این قابلیت بهش اجازه میده تا شما بتونید روی یک تایم فریم خاص، مثلا همون ۵ دقیقه که خودتون فرمودید، قیمت رو رصد کنید ولی سیگنالها یا روند رو بر اساس دادههای یک تایم فریم بالاتر مثل ۳۰ دقیقه یا ۱ ساعته دریافت کنید.
این ویژگی برای معاملهگرانی که با تایم فریمهای پایین کار میکنند، مثل اسکالپرها یا تریدرهای روزانه، فوقالعاده کاربردیه. دلیلش اینه که نویزهای موجود در تایم فریمهای پایین، که باعث سیگنالهای فالس زیادی میشن، تا حد زیادی فیلتر میشن.
شما در واقع با دیدن اندیکاتور تایم فریم بالاتر روی چارت ۵ دقیقهای، یک دید کلی از روند اصلی بازار پیدا میکنید. یعنی دیگه اون اتفاقی که گفتید تو ۵ دقیقه سیگنال خرید بگیرید و بعد برگرده چون روند اصلی نزولی بوده، کمتر پیش میاد. چون خطوط اندیکاتور بر اساس روند تایم فریم بالاتر شکل میگیرن.
یکی از کاربردهای اصلیش هم که تو مقاله اشاره شد، تعیین استاپ لاسه. وقتی شما حد ضرر رو بر اساس تغییر رنگ خطوط اندیکاتور در تایم فریم بالاتر تعیین میکنید، این حد ضرر از نوسانات کوچیک تایم فریم پایین در امان میمونه و شانس استاپ هانت شدن بیموردتون کمتر میشه.
در مورد اعتماد بهش، بله حق با شماست که هیچ اندیکاتوری نباید به تنهایی استفاده بشه. این اندیکاتور با این قابلیت، یک فیلتر قوی برای استراتژی شماست. یعنی شما استراتژی ورودتون رو طبق معمول تو ۵ دقیقه پیدا میکنید، ولی برای تاییدیه روند و خصوصا مدیریت خروج و حد ضرر، از این دیدگاه تایم فریم بالاتر کمک میگیرید.
پیشنهاد میکنیم حتماً با حساب دمو این قابلیت رو تست کنید و ببینید چطور میتونه دقت معاملات شما رو تو تایم فریمهای پایین افزایش بده. با این روش، شما هم از سرعت عمل و پویایی تایم فریمهای پایین بهرهمند میشید و هم از ثبات و اعتبار تایم فریمهای بالاتر برای تصمیمگیریهای مهمتر.