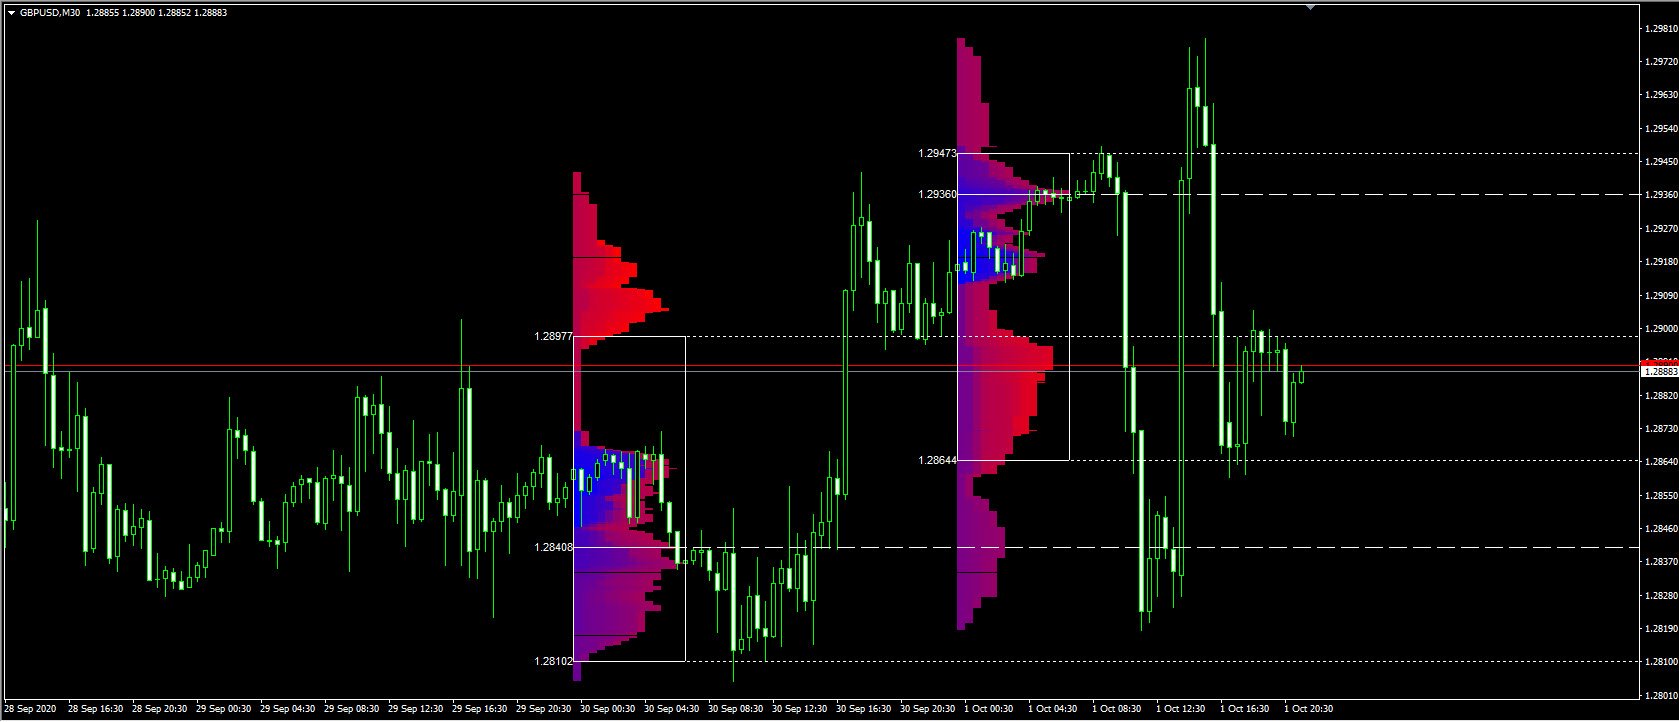
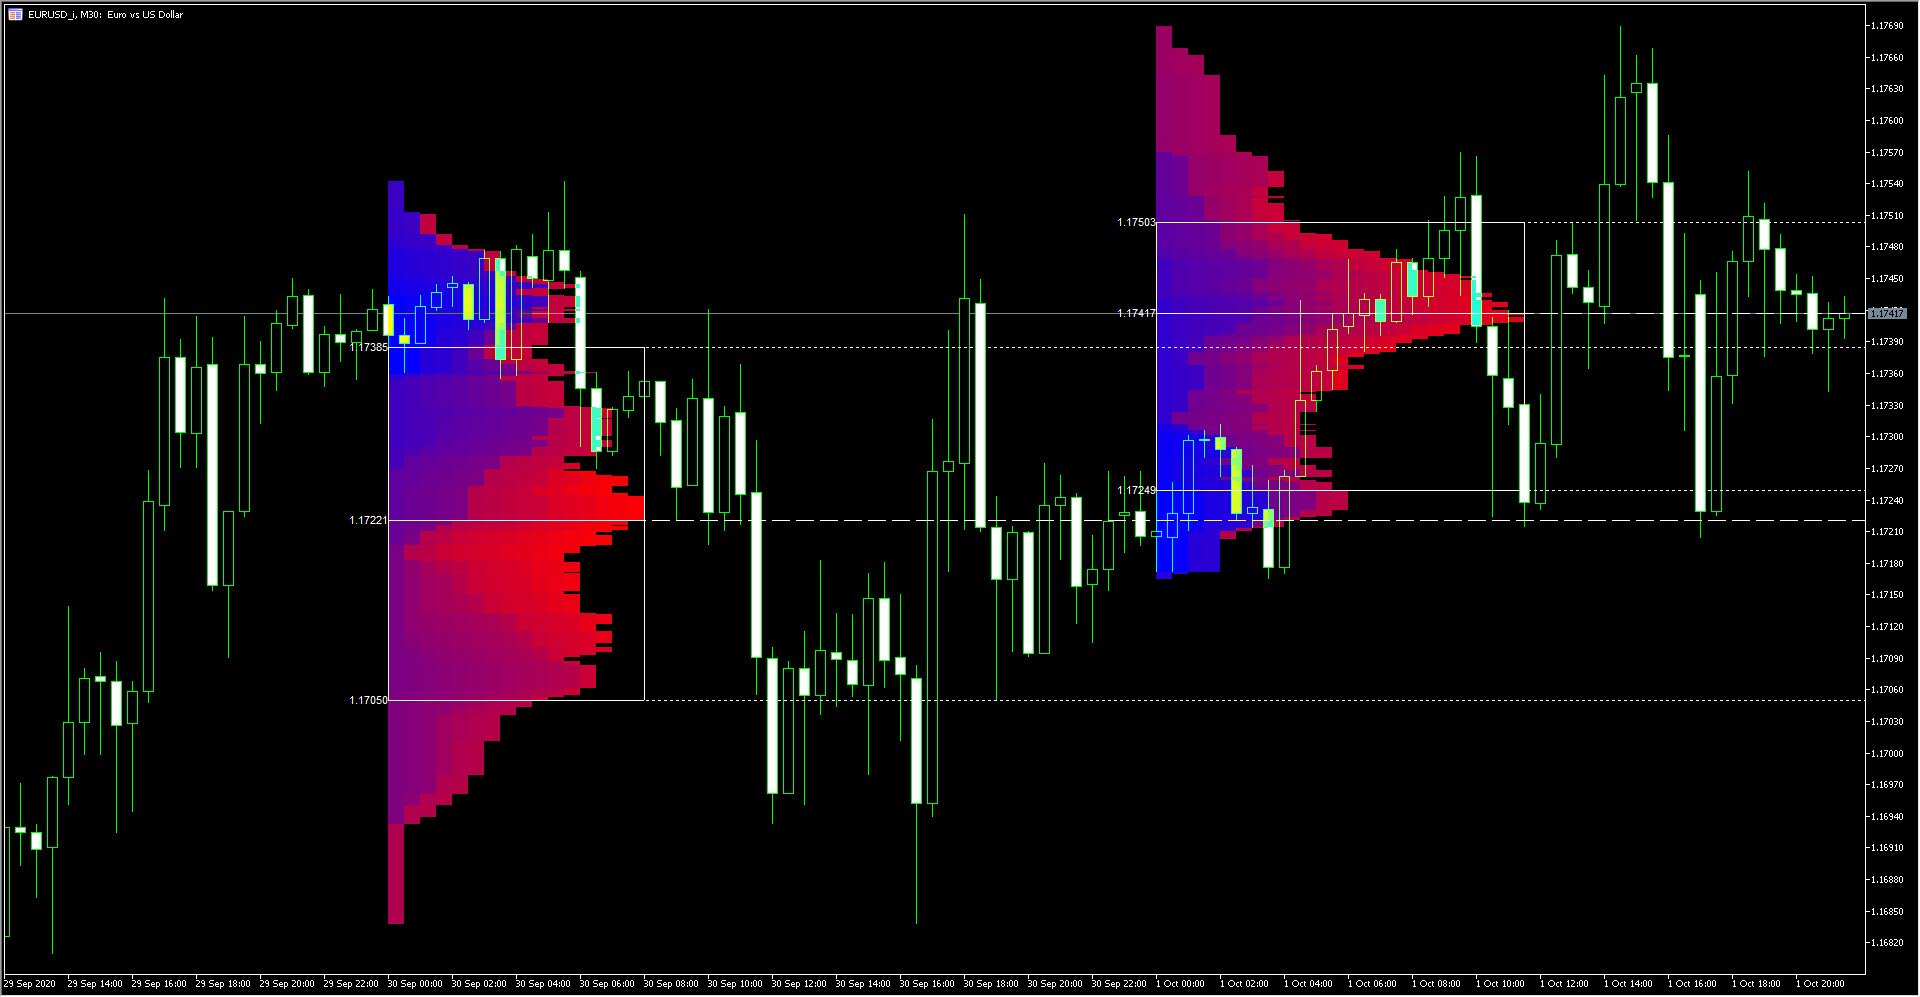
In this post, we are going to introduce you the Chart Profile Indicator and teach you how to use it.
Profile Chart Indicator is one of the strongest and most practical indicators Which is very useful and practical for technical analysts.
This indicator can also be used alongside your trading strategies and act as a strong filtering tool which reduces the percentage of your analytical error.
Chart Profile Indicator Overview
This indicator presents a classic view of the market that has the ability to:
Illustrate the strength and volatility of the price over a specific period of time.
This Forex indicator also has the ability to set the most important price levels along with its power and volatility, as it displayed it in a classic way in a certain range.
The Chart Profile indicator has the ability to check different time intervals in its settings. It Examines intervals from one minute to daily and make a classic view for intervals from daily, to weekly or monthly.
In this indicator, lower time intervals are more accurate and in longer time interval, it will show you the better understanding of the market.
One of the features of this Forex indicator is that it can draw a rectangle on the chart and Create a better view of the chart for the time period selected by you.
Of Other features of Chart Profile indicator we can point to different colors of this indicator when plotting on the chart. Please note that the indicator is drawn as a histogram on the chart.
This Forex indicator also has the ability to display the index Color based on rising or falling candlesticks and varies with the slightest price movement.
Download Chart Profile indicator for MetaTrader 4 and MetaTrader 5
We have prepared the Chart Profile indicator for MetaTrader 4 and 5 and you can use it with no limitations.
Download this indicator for MetaTrader 4

Download this indicator for MetaTrader 5

How to set Chart Profile indicator?
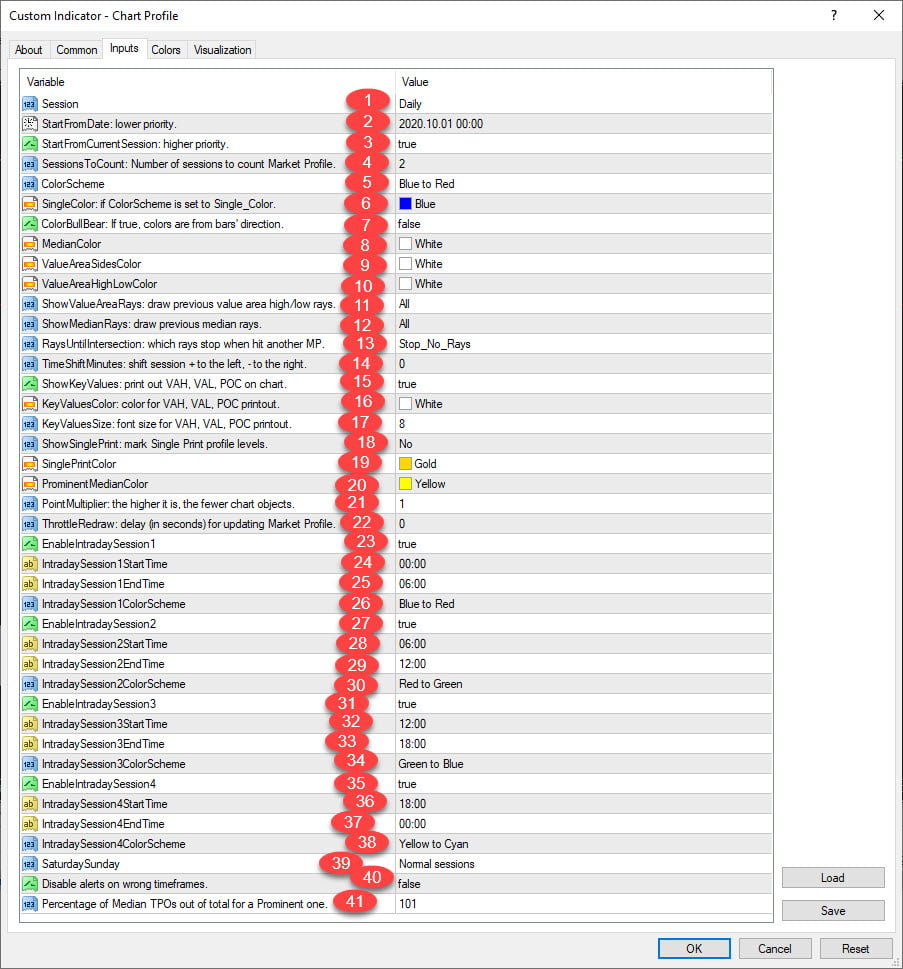
The settings of this Forex indicator based on entry parameters are as follows:

Session: Default is set to daily, but you can change it.
Trading session for market: daily, weekly, monthly, intraday and rectangular. To calculate a rectangular session, you should add a rectangular chart object called “MPR <Something” to the chart.
StartFromDate: This period is for calculating the space inside the rectangle. If StartFromCurrentSession is incorrect, the cursor starts indexing from this date and draws it to the past. For example, if you set it to 2020-01-20 and SessionToCount is equal to 2, it will draw the profiles for 2020-20-01 and 2020-01-19.
StartFromCurrentSession: If enabled, the cursor starts drawing from today.
SessionsToCount: This number is set to 2 by default For a few trading sessions to chart the market.
ColorScheme: The color scheme is used for blocks and you can change it depending on your preference. Blue to red – red to green – green to blue – yellow to turquoise – magenta to yellow – turquoise to magenta.
SingleColor: If ColorScheme is set to Single Color, this color is used to draw market indexes.
ColorBullBear: If enabled, the color of the profile blocks depends not on the history of the source bar but on its direction.
MedianColor: Control value color (middle).
ValueAreaSidesColor: The color of the side borders of the value area.
ValueAreaHighLowColor: The color of the area above and below the specified area.
ShowValueAreaRays: can be set to: Predict the price level above and below the area to the right of the chart. It Can be set to previous, current, previous and current session, all previous or all.
ShowMedianRays: can be set to predict the middle to the right of the chart. It Can be set to previous, current, previous and current session, all previous or all.
RaysUntilIntersection: it defines how to cut the median rays and values when the price range encounters the next trading session:
Stop_No_Rayes – No rays stop anywhere.
Stop_All_Rays – All rays stop at one intersection at the price of another session.
Stop_All_Rays_Except_Prev_Session – All Rays Except for the rays of the previous session, they stop at the intersection with the price of another session.
Stop_Only_Prevention_Session – Only rays from the previous session stop at an intersection with the price of another session.
Advanced Chart Profile indicator settings
TimeShiftMinutes: Time shift for sessions, in minutes. A positive value moves the start of the session to the left. Negative – to the right
ShowKeyValues: If true, Value Area High, Value Area Low and Point of Control. They all Are displayed on the left side of the market view.
KeyValuesColo: Color settings for printing on the chart
KeyValuesSize: Font size for printing on a chart
ShowSinglePrint: can be set to Leftside or Rightside. And specifies a single print profile – the part of the profile that has only one TPO width
SinglePrintColor: If ShowSinglePrint is not set to number, it is monochrome for print markup.
ProminentMedianColor: If ProminentMedianPercentage is set to 100 or less. It Will create color for the highlighted middle (PPOC).
PointMultiplier: The higher, the wider the index box width and the smaller the chart objects. You can use this section to reduce the indicator load on the processor.
ThrottleRedraw: Delay in seconds that will be applied before each profile redesign. You can also use the section to reduce the indicator load on the processor.
EnableIntradaySessionN: If True and Session is set to Intraday. This indicator tries to plot the’s day market index #N in the chart.
IntradaySessionNStartTime: Start time in HH: MM template for in-day session #N
IntradaySessionNEndTime: End time in HH: MM template for in-day session #N
IntradaySessionNColorScheme: Color scheme for daily #N session
Items 27 to 38: Relates to time settings that can be adjusted as above.
39- SaturdaySunday: How to view and schedule Saturday and Sunday sessions:
Regular sessions – Saturdays and Sundays are considered regular meetings with their daily and intraday meetings.
Ignore Saturday and Sunday – Saturday and Sunday candlesticks are ignored.
Attach Saturday and Sunday – Saturday candlesticks attach the Friday session.
Sunday candlesticks are attached to the Monday session.
40- DisableAlertsOnWrongTimeframes: No alarm alert if set correctly Does not appear incorrect in using market index with time period / session combination.
41- ProminentMedianPercentage: Percentage of TPOs that may need to occur at a medium level to be recognized as a significant percentage (PPOC).
For example, if you set it to 50%, if you have at least 24 TPOs per day in the M30 interval. A middle is defined as a highlight. If set to 101, no highlight middle is possible.
We hope you find this indicator useful.
