
Download Band Moving Average Indicator for MetaTrader 4 and MetaTrader 5
Download of Band Moving Average Indicator prepared for financial markets and Forex market participants
This Forex indicator can be a very useful indicator for you in technical analysis. And it has an active and important role in identifying the support and resistance levels of the chart you are dealing with.
BMA MetaTrader or Band Moving Average Indicator has been Created by using the original moving Average and the idea of a Forex analyst.
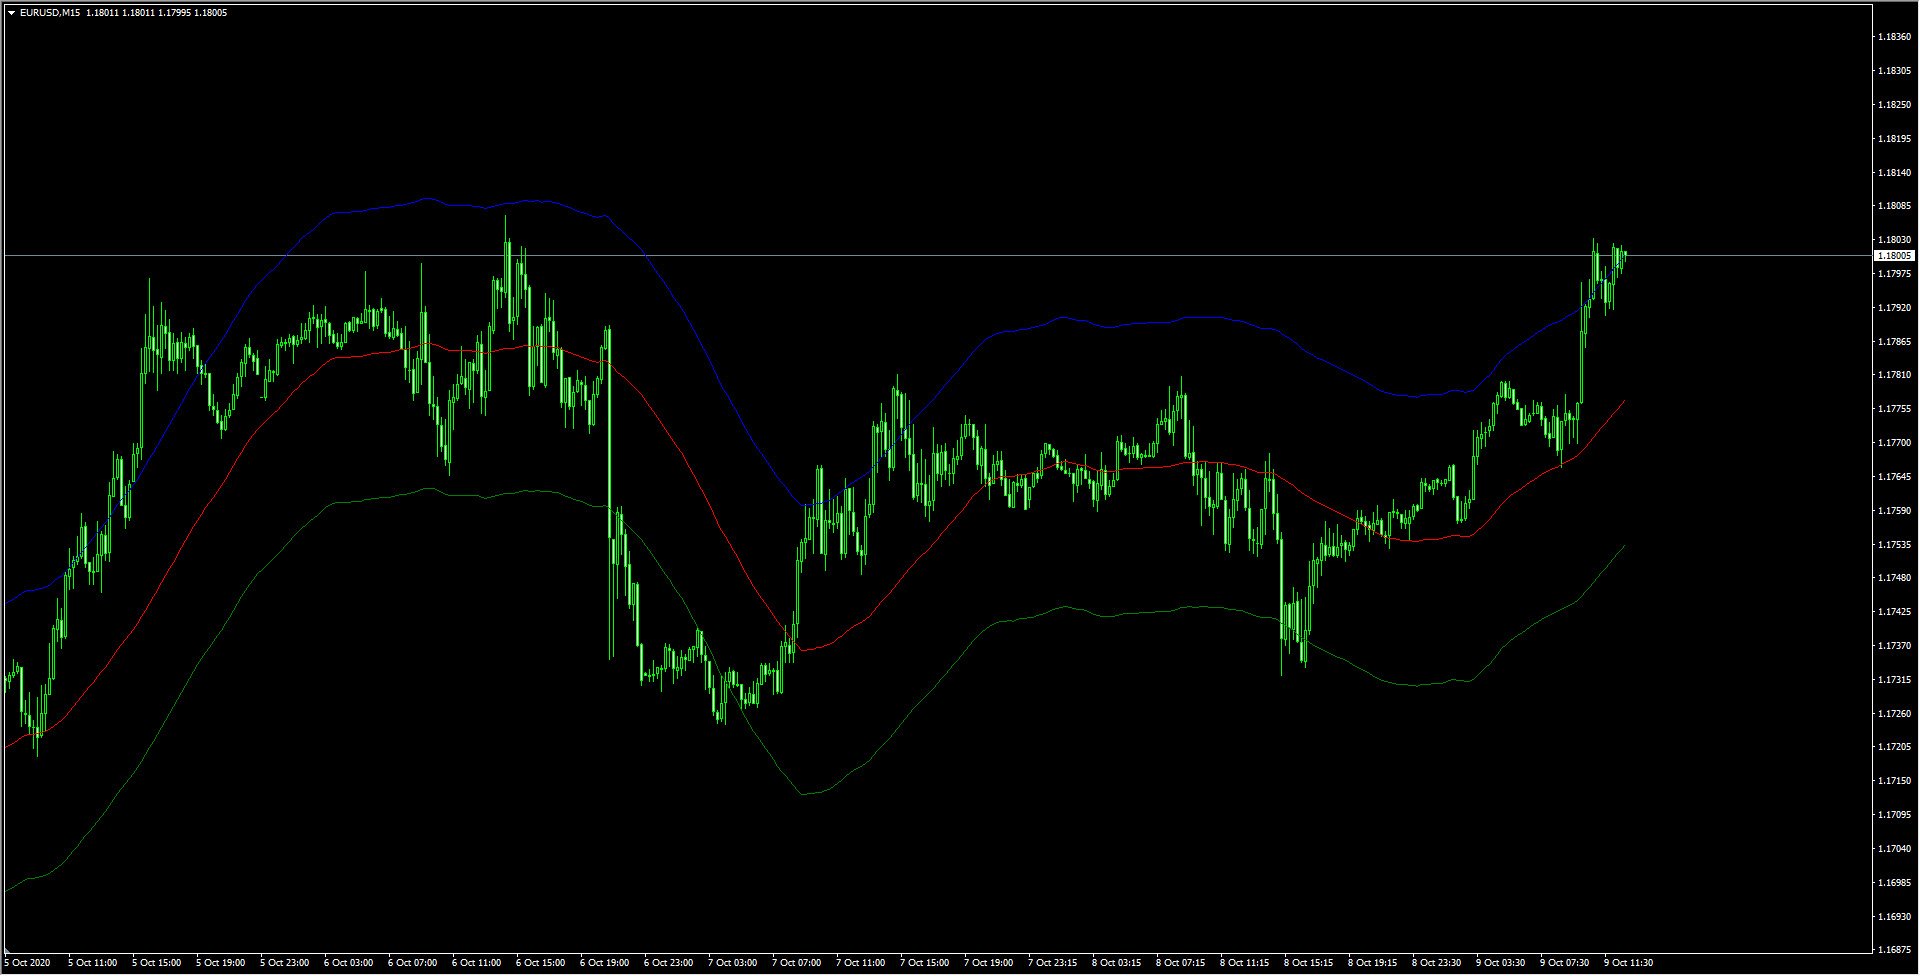
This indicator shows itself in three lines:
The lines shown in this indicator are the middle moving average line for MT4 / MT5 (can be simple, exponential or weighted)
The top line is the same as the middle line, but with 2% increase (by default).
The bottom line is the same as the middle line, but it comes down 2%.
These two additional lines act as support and resistance levels.
This indicator is prepared for both MetaTrader 4 and MetaTrader 5.
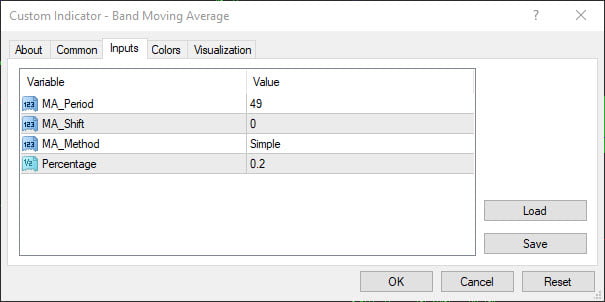
Band Moving Average indicator settings
MA_ period (default 49) – Standard moving average period (middle line).
MA_Shift (default = 0) – Horizontal shift for all chart lines.
MA_ method (default = simple) – A method for plotting MA.
Percentage (default = 2) – The number of percentages for vertical movements of the upper and lower bands compared to the middle line.
You will also be able to change these settings easily in the indicator whenever you like.
You will also be able to change these settings easily in the indicator whenever you like.
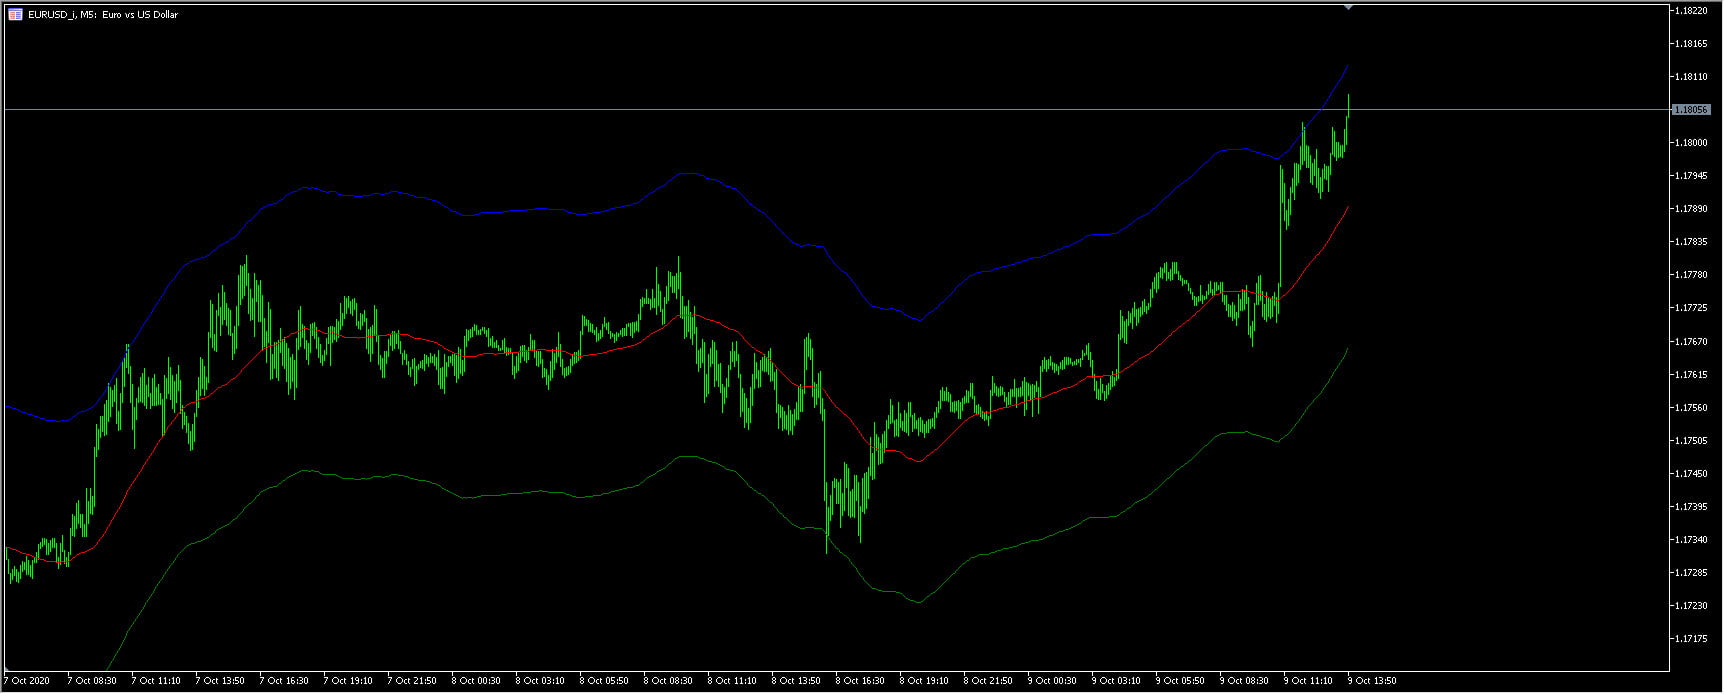
Band Moving Average indicator for MetaTrader 5
You can download Band Moving Average Indicator for MetaTrader 4 and MetaTrader 5 in this post for free:
How to use the Band Moving Average Indicator?
The best way to use this Forex indicator is to attach it to the EUR / USD H4 chart.
You can sell when the price reaches the higher band and buy when the price reaches the lower band. Stop loss level is recommended in any of the cases
Because the price may sometimes break that level or the lines may suddenly change direction.
The indicator installation instruction in MetaTrader 4
⦁ To install the indicator in MetaTrader, first click on File from the top of the MetaTrader tab.
⦁ Then select the Open Data Folder menu from the menu opened.
⦁ Open the MQL4 folder to install the indicator
⦁ And then copy and paste in the indicator folder.
⦁ Now close your meta trader and open it again.
In the relevant menu you will see that the indicator has been added to your list of indicators.
Just double-click on it in MetaTrader so that you can call and place it on the chart.
Hey, awesome article on the Band Moving Average indicator! I’m really digging the simplicity of how those upper and lower bands can act like dynamic support and resistance. The idea of selling when price hits the upper band and buying at the lower band seems like a pretty straightforward strategy for catching some moves.
I’ve been trying to get a feel for indicators like this and often wonder about the best times to apply them. Market volatility and participant volume can really change how effective a strategy is, right? It’s not always a one-size-fits-all thing across the entire 24-hour cycle.
Specifically, the article recommends using this BMA indicator on the EUR/USD H4 chart, which makes a lot of sense given the pair’s liquidity. H4 charts are great for filtering out some of the noise, but even then, certain periods definitely have more action.
So, my real question is about the trading sessions. Given that EUR/USD is recommended, would this particular strategy of buying at the lower band and selling at the upper band be more effective or show clearer signals during the London session, or maybe when New York comes online and there’s that overlap?
Just trying to optimize my approach here and make sure I’m using this cool indicator at its peak potential. Any insights on which sessions might give the best results for this specific EUR/USD H4 setup would be super helpful!
That’s a fantastic question and you’ve hit on a really crucial aspect of applying any technical indicator: market context. Understanding when and why certain strategies perform better is key to successful trading, and considering trading sessions for EUR/USD is definitely the right line of thinking for the Band Moving Average strategy.
When we talk about EUR/USD, we’re dealing with the world’s most traded currency pair, and its behavior is heavily influenced by the European and North American trading sessions. The H4 timeframe helps smooth out some of the intra-day choppiness, but the underlying volatility and volume still ebb and flow with these major market openings.
For the London session, which is often considered the most liquid for EUR/USD, you typically see increased volatility and tighter spreads. This can be a double-edged sword for the BMA strategy. On one hand, the increased volume means that price movements are generally more ‘genuine’ and less prone to false breakouts. When the price hits the upper or lower band during London hours, especially if it’s a calm day without major news, the increased participation can lead to a more reliable bounce or reversal. However, the higher volatility can also mean that the price might break through a band with more force if a strong trend is developing, so your stop-loss becomes even more critical. Look for consolidation around the bands followed by a clear rejection candle.
Moving into the New York session, particularly after the initial few hours, you often see a continuation or a reversal of London trends. The US market brings its own set of economic data and participants, which can inject fresh momentum. If the price reaches a BMA band during the New York session, especially when European markets are still open (the overlap), the increased liquidity from both continents can provide strong confirmation for a reversal trade. The New York session can also be prone to ‘fake outs’ around major news releases, so always be mindful of the economic calendar. A strong move into a band with a clear rejection candle during New York hours can be a good signal, but always watch for follow-through.
The overlap between the London and New York sessions (roughly 8 AM to 12 PM EST) is often the most volatile period for EUR/USD. This is where you might see the most aggressive movements and potentially the strongest reversals or breakouts from the BMA bands. If the price reaches a band during this overlap, the sheer volume of participants from both major financial centers can make the reversal signals more potent, but also the risk of a strong breakout is higher. This period demands extra vigilance and usually offers more opportunities but also requires tighter risk management.
Ultimately, while the strategy of selling at the upper band and buying at the lower band on the EUR/USD H4 chart can be effective across sessions, you’ll likely find the most clarity and potentially stronger signals during the London session and the London-New York overlap. These periods generally offer the best combination of liquidity and volatility. Always remember to combine this with other forms of analysis, like checking for confluence with other support/resistance levels, candlestick patterns, and importantly, being aware of any high-impact news releases that could override technical signals. And as the article stresses, always use a stop loss! Hope this helps you fine-tune your approach!