

CCI Indicator یکی از محبوبترین و کاربردیترین ابزارهای تحلیل تکنیکال در بازارهای مالی از جمله فارکس است که به معاملهگران در شناسایی مناطق اشباع خرید و فروش و همچنین تشخیص پایان چرخههای بازار کمک میکند. نسخه جدید و بهینهشده این ابزار با نام اندیکاتور CCI 2020، با ارائه سیگنالهای دقیقتر و فیلتر کردن نوسانات کاذب بازار، توانسته جایگاه ویژهای در میان تریدرهای مبتدی و حرفهای پیدا کند.
استفاده از ابزارهای تاییدیه در کنار استراتژیهای معاملاتی، همواره ضریب موفقیت در معاملات را افزایش میدهد. اندیکاتور CCI 2020 با محاسبات دقیق و واکنش سریع به تغییرات مومنتوم قیمت، به شما این امکان را میدهد تا نقاط ورود و خروج بهینه را با اطمینان بیشتری شکار کنید. در صورتی که به دنبال ارتقای سیستم معاملاتی خود هستید و میخواهید از ابزارهای حرفهایتری بهرهمند شوید، پیشنهاد میکنیم حتماً برای آشنایی و دانلود بهترین اندیکاتورهای کاربردی فارکس اقدام کنید تا با ترکیب آنها، استراتژی قدرتمندتری بسازید.
در این مقاله، قصد داریم به بررسی جامع و آموزش کامل نصب، تنظیمات و نحوه سیگنالگیری از اندیکاتور CCI 2020 بپردازیم. با مطالعه این مطلب یاد میگیرید که چگونه این اسیلاتور قدرتمند را در پلتفرم معاملاتی خود پیادهسازی کرده و با ترکیب آن با سایر روشهای تحلیلی، سودآوری خود را در بازار پرنوسان فارکس به حداکثر برسانید.
| ویژگی | توضیحات |
|---|---|
| نام اندیکاتور | CCI (Commodity Channel Index) یا کانال کالا |
| نوع اندیکاتور | اسیلاتور (نوسانگر) |
| کاربرد اصلی | تشخیص اشباع خرید و فروش، تایید روند و شناسایی واگرایی |
| دوره زمانی پیشفرض | 20 روزه |
| دوره زمانی پیشنهادی (فارکس) | 12 تا 14 روزه (سیگنال بیشتر) |
| مهمترین سطوح (Levels) | خط صفر، سطح 100+ و سطح 100- |
| شرط سیگنال خرید | عبور اندیکاتور از سطح 100+ و باقیماندن بالای آن |
| شرط سیگنال فروش | عبور اندیکاتور از سطح 100- و باقیماندن زیر آن |
| بازارهای مناسب | کالا، سهام و فارکس (جفت ارزها) |
راهنمای جامع اندیکاتور CCI در فارکس
اندیکاتور کانال کالا (CCI) ابزاری قدرتمند برای فیلتر کردن سیگنالهای اشتباه و تشخیص نقاط ورود و خروج دقیق در بازارهای مالی است.
ماهیت اندیکاتور CCI
این ابزار یک اسیلاتور نوساننما است که در ابتدا برای بازار کالا طراحی شد، اما در فارکس کاربرد فراوانی یافته و فاصله قیمت از میانگین متحرک را اندازهگیری میکند.
سطوح کلیدی نوسان
این اندیکاتور در محدودهای بین منفی ۱۰۰ و مثبت ۱۰۰ نوسان میکند. خروج نوسانگر از این دو سطح مهم، نشاندهنده ورود به مناطق اشباع خرید یا اشباع فروش است.
تنظیمات بهینه دوره زمانی
با وجود اینکه دوره پیشفرض ۲۰ روز است، اما بسیاری از تریدرهای فارکس دورههای زمانی ۱۲ تا ۱۴ روزه را برای افزایش حساسیت و دریافت سیگنالهای بیشتر ترجیح میدهند.
سیگنالهای ورود و خروج
عبور و تثبیت خط اندیکاتور بالای سطح +۱۰۰ نشانه قدرت گرفتن روند صعودی (خرید) و نفوذ به زیر سطح -۱۰۰ نشانه شروع یک روند نزولی قوی (فروش) میباشد.
تشخیص واگراییها (Divergence)
یکی از حرفهایترین کاربردهای CCI، شناسایی واگرایی بین حرکت قیمت و اندیکاتور است که هشداری بسیار قوی برای پیشبینی بازگشت روند محسوب میشود.
قانون طلایی: فقط یک فیلتر!
هرگز تنها با اتکا به سیگنالهای CCI معامله نکنید. این ابزار باید به عنوان یک فیلتر تأییدی در کنار سایر اندیکاتورها و استراتژی شخصی شما به کار گرفته شود.
آشنایی با CCI Indicator: فراتر از یک اسیلاتور ساده
CCI indicator مخفف “Commodity Channel Index” هست. همونطور که از اسمش پیداست، در ابتدا بیشتر برای بازارهای کالا و سهام طراحی شده بود، اما تجربه نشون داده که توی بازارهای دیگه مثل فارکس هم میتونه حسابی کاربردی باشه. این اندیکاتور یه اسیلاتوره، یعنی نوسانات قیمت رو نسبت به میانگین متحرکش نشون میده. فرمولش بر اساس قیمت روزانه و میانگین متحرک محاسبه میشه.
CCI، مثل بقیه اسیلاتورهای معروف مثل RSI و MACD، یه مقیاس داره. خط وسطش روی صفره، سطح پایینش منفی 100 و سطح بالاش مثبت 100. اکثر نوسانات توی این محدوده بین منفی 100 تا مثبت 100 اتفاق میافته. اما وقتی اندیکاتور از این محدودهها خارج میشه، نشوندهنده مناطق اشباع خرید یا اشباع فروش هست.
چطور از CCI Oscillator استفاده کنیم؟
CCI oscillator به شما نشون میده که قیمت چقدر از میانگین متحرکش در بازه زمانی مشخصی که شما تعیین کردید، فاصله گرفته. با تنظیمات درست، میتونید انحراف قیمت رو نسبت به میانگین متحرک به خوبی ببینید.
تنظیمات CCI Indicator: پیدا کردن نقطه طلایی
به صورت پیشفرض، میانگین متحرک توی CCI روی دوره 20 روزه تنظیم شده. اما طبق تجربههایی که توی بازار دیدم و تحقیقاتی که انجام شده، خیلی از تریدرها (مخصوصاً توی فارکس) دوره زمانی بین 12 تا 14 روز رو ترجیح میدن. دلیلش هم واضحه: هرچی دوره زمانی کوتاهتر باشه، نوسانات بیشتری رو نشون میده و سیگنالهای بیشتری تولید میکنه. از اون طرف، اگه دوره زمانی رو طولانیتر کنید، اندیکاتور حساسیت کمتری پیدا میکنه و سیگنالهای کمتری میده.
نکته کلیدی اینجاست: دوره زمانی کوتاهتر یعنی سیگنالهای بیشتر ولی با دقت کمتر. دوره زمانی طولانیتر یعنی سیگنالهای کمتر ولی با دقت بیشتر. اما یادتون باشه، دورههای خیلی طولانی ممکنه باعث بشه فرصتهای معاملاتی خوب رو از دست بدید.
پس، بهترین کار اینه که با آزمون و خطا، یه دوره زمانی بهینه (مثلاً بین 12 تا 14، یا حداکثر 20 روز) برای خودتون پیدا کنید تا هم فرصتها رو از دست ندید و هم از سیگنالهای دقیقتر بهرهمند بشید.
گرفتن سیگنال از CCI Indicator: فراتر از خطوط
گرفتن سیگنال از CCI کار پیچیدهای نیست. به طور کلی:
- سیگنال خرید: وقتی اندیکاتور از سطح +100 عبور میکنه و بالای اون باقی میمونه، میتونه نشونهای از شکلگیری یه روند صعودی قوی باشه.
- سیگنال فروش: وقتی اندیکاتور به زیر سطح -100 میره و پایین اون باقی میمونه، میتونه نشونهای از شروع یه روند نزولی قوی باشه.
اما یه نکته خیلی مهم رو هرگز فراموش نکنید: هرگز و هرگز فقط بر اساس سیگنال CCI تصمیم به معامله نگیرید. این سیگنالها فقط و فقط برای فیلتر کردن سیگنالهای دیگه و تأیید استراتژی شخصی شما هستن.
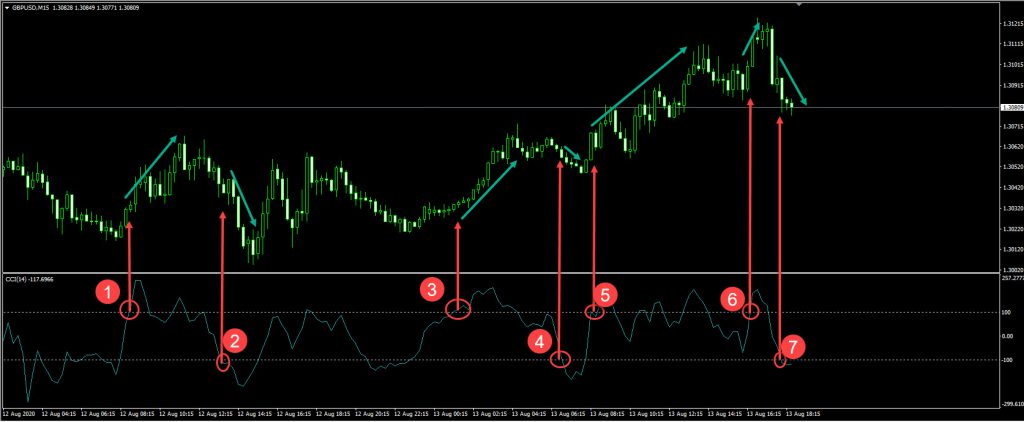
همونطور که توی تصویر بالا میبینید، بازار در بعضی مواقع به سیگنالها واکنش نشون داده. بعضی وقتها قویتر و بعضی وقتها ضعیفتر. توی موارد 4 و 6، سیگنال صادر شده ولی حرکت قابل توجهی اتفاق نیفتاده. اما در موارد 1، 2، 3 و 5، با صدور سیگنال، روند مطابق پیشبینی حرکت کرده. این دقیقاً همون دلیلیه که میگم یه اندیکاتور به تنهایی برای معامله کافی نیست و باید به عنوان یه فیلتر در کنار ابزارهای دیگه یا استراتژی خودتون ازش استفاده کنید.
واگرایی (Divergence) با CCI Indicator: پیشبینی برگشتها
یکی از قابلیتهای خیلی مهم CCI، مثل RSI و MACD، تشخیص واگراییهاست. واگرایی توی CCI میتونه خیلی قوی باشه و نشوندهنده تأیید روند فعلی، ادامه روند، یا حتی برگشت روند باشه. این واگراییها برای تریدرها خیلی ارزشمند هستن.
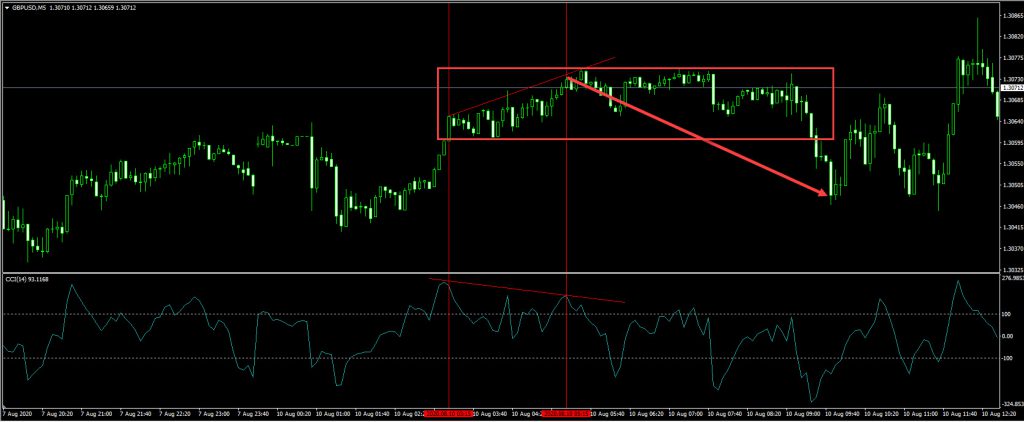
تصویر بالا به وضوح نشون میده که چطور CCI یه واگرایی رو تشخیص داده و باعث شده بازار از روند صعودی به نزولی تغییر جهت بده و بعدش هم سقوط کنه.
ترفندهایی برای استفاده حرفهای از CCI Indicator
یکی از بهترین کاربردهای CCI، تشخیص و استفاده از روندها، مخصوصاً در تایمفریمهای بالاتر هست. CCI یه ابزار قدرتمنده، اما باید بدونید که کاربرد اصلیش توی بازارهای سهام بوده و کمتر روی جفت ارزها استفاده میشده. البته طبق تجربه شخصی خودم، این اندیکاتور میتونه روی جفت ارزها هم نتایج خوبی بده و به زودی یه استراتژی مخصوص با این اندیکاتور رو بهتون آموزش میدم.
CCI indicator، چه بهش بگید اندیکاتور کانال کالا یا اسیلاتور CCI، با تنظیمات مختلف نتایج متفاوتی میده. توی تایمفریمهای مختلف، محاسبات متفاوتی داره و حتی کاربردهاش توی جفت ارزها یا سهام مختلف با تایمفریمهای متفاوت، فرق میکنه. پس، هرگز و هرگز بدون تمرین و تسلط کافی، این اندیکاتور رو روی حساب واقعیتون اجرا نکنید.
CCI indicator مثل یه چاقوی جراحیه؛ هم میتونه به کارتون بیاد و هم میتونه خطرناک باشه. نتیجه نهایی دست خودتونه. چاقوی جراحی به تنهایی درمان نیست، اما میتونه ابزار مفیدی باشه. استفاده صرف از CCI indicator فقط منجر به مارجین کال میشه! برای سودآوری باهاش، به ابزارهای دیگه (اندیکاتورهای دیگه) یا استراتژی معاملاتی خودتون نیاز دارید.