

اندیکاتور مووینگ اوریج (Moving Average) در سال ۲۰۲۰ به برتری خود پایان داده و جایگاه ویژهای در میان تحلیلگران تکنیکال بازارهای مالی فارکس را کسب کرده است. تحقیقات انجامشده در سالهای ۲۰۱۹ و ۲۰۲۰ نشان میدهد که این اندیکاتور به عنوان یکی از برترین اندیکاتورهای کاربردی سال ۲۰۲۰ شناخته شده است.
اندیکاتور مووینگ اوریج با استفاده از میانگین قیمتها در یک بازه زمانی مشخص، تحلیل و پیشبینی روند بازارها را به کاربران ارائه میدهد. با توجه به قابلیتهای ویژه این اندیکاتور و نتایج مثبت حاصل از تحقیقات، تحلیلگران تکنیکال در بازارهای مالی فارکس به صورت گسترده از این اندیکاتور استفاده میکنند.
در این مقاله، به بررسی و تحلیل دقیقتر این اندیکاتور پرداخته و نحوه استفاده از آن در تحلیل بازارهای مالی فارکس را بررسی خواهیم کرد. دلیل اینکه اکثر تحلیلگران تکنیکال بازارهای مالی، moving average را مورد استفاده قرار میدهند، این است که این اندیکاتور در عین کاربردی بودن، بسیار ساده بوده و استفاده از آن راحت است.
اندیکاتور مووینگ اوریج moving average از دسته اندیکاتورهای روندنما یا همان trend است. برای آشنایی با کاربردیترین اندیکاتورهای فارکس میتوانید این مقاله را مطالعه کنید.
راهنمای جامع اندیکاتور مووینگ اوریج (MA)
ابزاری قدرتمند و ساده برای تشخیص روندها، نوسانگیری و شناسایی نقاط طلایی ورود و خروج در بازار فارکس.
تشخیص روند بازار
سادهترین کاربرد مووینگ اوریج؛ اگر قیمت بالای خط باشد روند صعودی، و اگر پایین باشد روند نزولی است.
سیگنالهای معاملاتی
عبور قیمت از خط مووینگ اوریج (شکست خط) میتواند نشانهای قوی برای تغییر روند و فرصت ورود به معامله باشد.
اهمیت دوره زمانی
دورههای کوتاه (اعداد کوچک) به قیمت حساسترند و نوسان بیشتر دارند، اما دورههای بلندمدت ثبات بیشتری ارائه میدهند.
استراتژی تقاطع (Crossover)
استفاده همزمان از دو مووینگ اوریج (مثلاً ۳۰ و ۶۰)؛ قطع کردن خط کندتر توسط خط سریعتر، سیگنالی بسیار معتبر است.
مدیریت ریسک و نوسان
این اندیکاتور با میانگینگیری از قیمتها، نوسانات هیجانی بازار را حذف کرده و تصویری شفافتر از حرکت واقعی قیمت میدهد.
حمایت و مقاومت پویا
خطوط مووینگ اوریج اغلب به عنوان سطوح حمایت (در روند صعودی) و مقاومت (در روند نزولی) عمل میکنند.
| ویژگی / نوع | میانگین متحرک ساده (SMA) | میانگین متحرک نمایی (EMA) |
|---|---|---|
| نحوه محاسبه | وزندهی یکسان به تمام قیمتها | وزندهی بیشتر به قیمتهای اخیر |
| سرعت واکنش | کندتر (با تاخیر نسبت به قیمت) | سریعتر (واکنش فوری به نوسانات) |
| کاربرد اصلی | تشخیص روندهای بلندمدت و حمایت/مقاومت | معاملات کوتاهمدت و نوسانگیری |
| میزان نویز (خطا) | کمتر (نوسانات را فیلتر میکند) | بیشتر (ممکن است سیگنال کاذب دهد) |
| مناسب برای | تایمفریمهای روزانه و هفتگی | تایمفریمهای دقیقهای و ساعتی |
کاربرد اندیکاتور مووینگ اوریج

اندیکاتور مووینگ اوریج یکی از اندیکاتورهای حیاتی در تحلیل تکنیکال بازارهای مالی است. توسط توماس اندروز در سال ۱۹۷۰ توسعه یافته، این اندیکاتور به عنوان یک ابزار قدرتمند برای پیشبینی جهت حرکت قیمت به کار گرفته میشود.
مووینگ اوریج در واقع میانگین قیمتهای روزانه یک دارایی به ازای یک بازه زمانی مشخص است. این اندیکاتور معمولاً با استفاده از میانگینهای ساده یا میانگینهای وزندار محاسبه میشود. اندیکاتور مووینگ اوریج به عنوان نمایندهای از روند قیمت برای جلب حرکت دارایی استفاده میشود. با مشاهده تغییرات این اندیکاتور، میتوان پیشبینی کرد که قیمت دارایی به سمت بالا یا پایین حرکت میکند.
استفاده از اندیکاتور مووینگ اوریج در تحلیل تکنیکال میتواند به تریدرها و سرمایهگذاران کمک کند تا بهترین نقاط ورود و خروج را در بازارها تشخیص دهند. با مشاهده تغییرات این اندیکاتور در طول زمان، تریدرها میتوانند تحلیل کنند که آیا قیمت دارایی در حال حرکت به سمت بالا یا پایین است.
اگر مووینگ اوریج به سمت بالا حرکت کند، این نشان دهنده یک روند صعودی است و تریدرها ممکن است بخرند. اگر مووینگ اوریج به سمت پایین حرکت کند، این نشان دهنده یک روند نزولی است و تریدرها ممکن است بفروشند. با استفاده از اندیکاتور مووینگ اوریج، تحلیلگران بازار میتوانند نقاط ورود و خروج موثرتری را در بازارها تعیین کنند.
اندیکاتور مووینگ اوریج به تریدرها کمک میکند تا از تغییرات قیمت داراییها در طول زمان بهرهمند شوند و به صورت بهینه وارد بازار شوند. این اندیکاتور نه تنها به بهبود تصمیمگیری در مورد خرید و فروش کمک میکند بلکه میتواند به تریدرها کمک کند تا ریسکهای خود را کاهش داده و سود بیشتری حاصل کنند.
استفاده از اندیکاتور مووینگ اوریج در تحلیل تکنیکال به تریدرها و سرمایهگذاران امکان میدهد تا تصمیمات بهتری در مورد خرید و فروش داراییها بگیرند. با مراقبت از تغییرات این اندیکاتور، تریدرها میتوانند به طور موثرتر به بازار نگاه کنند و سود بیشتری به دست آورند. این اندیکاتور میتواند یک ابزار اساسی در اختیار تریدرها قرار گیرد تا به آنها کمک کند تا تصمیمات بهتری در مورد ترید خود بگیرند.
یکی از کاربردهای اصلی این اندیکاتور، تشخیص روند است. از طریق این اندیکاتور، میتوان در تحلیلها شروع و پایان روند و حتی بازگشتهای قیمتی را تشخیص داد. استفاده از این اندیکاتور در تحلیل تکنیکال یکی از مهمترین کاربردهاست.
در ضمن، مووینگ اوریج نقش مهمی در تشخیص سیگنالهای خرید و فروش نیز دارد و به عنوان یک اندیکاتور پایه در فرمول اندیکاتورهای دیگر مانند بولینجر باند نقش بسزایی ایفا میکند.
ساختار اندیکاتور مووینگ اوریج
اندیکاتور مووینگ اوریج یا همان میانگین متحرک، با تقسیم جمع آخرین قیمتها بر تعداد بسته شدهها، یک خط را بر روی چارت شما ترسیم میکند. به عنوان مثال، برای محاسبه میانگین متحرک در یک دوره ۷، قیمت شروع و پایان در ۷ دوره اخیر را جمع میکند، نتیجه را بر ۷ تقسیم میکند و در نمودار نمایش میدهد.
در دورههای بعدی نیز به همین روش عمل میکند و میانگین متحرک را در چارت ترسیم میکند. عدد دوره میتواند به صورت ساعتی، روزانه، یا هفتگی انتخاب شود و اندیکاتور میانگین متحرک بر اساس آن عمل میکند.
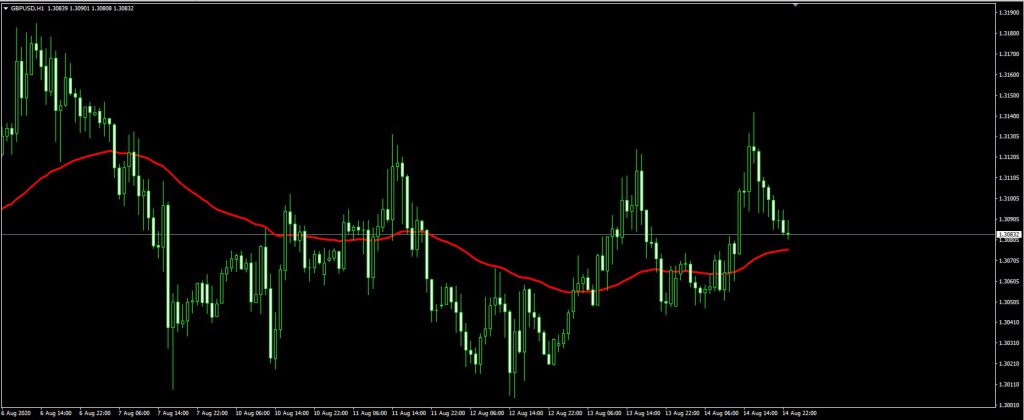
اعدادی که در دورهها محاسبه و بدست میآیند، با یک خط در روی چارت به یکدیگر متصل میشوند. در تصویر زیر، میانگین متحرک برای دوره ۶۰ با استفاده از اندیکاتور مووینگ اوریج به نمایش درآمده است.
عدد تعیین شده برای دوره هرچقدر کوچکتر باشد میانگین گیری حساستر میشود و نوسان بیشتر خواهد داشت. در این حالت عدد بدست آمده به قیمتها نزدیک تر خواهد بود. هرچه عدد تعیین شده برای دوره بزرگتر باشد میانگین گیری از حساسیت کمتری برخوردار خواهد بود. در این حالت، معمولا فاصله با قیمت فعلی بیشتر خواهد بود.
نکته لازم به تذکر اینکه: نه دوره بیش از حد کوچک مفید خواهد بود و نه دوره های بیش از حد بزرگ سعی کنید بر اساس استراتژی خودتان دوره های مورد نظر را تنظیم کنید .
ویژگیهای اندیکاتور مووینگ اوریج

Moving Average Envelope یا همان اندیکاتور مووینگ اوریج انولوپ، یکی از ابزارهای قدرتمند و محبوب در تحلیل تکنیکال است. این اندیکاتور بر پایه میانگین متحرک (MA) طراحی شده و به معاملهگران کمک میکند تا علاوه بر مطالعه و تشخیص روند بازار، نقاط بازگشت قیمتی و نواحی مهم را با دقت بالاتری شناسایی کنند. در ادامه، ساختار و مهمترین ویژگیهای این اندیکاتور را بررسی کردهایم:
۱. ساختار اندیکاتور
این ابزار از یک خط میانگین متحرک مرکزی (که معمولاً بر اساس قیمت بسته شدن یا Closing Price محاسبه میشود) و دو باند نوسانی در بالا و پایین آن تشکیل شده است که به صورت انعطافپذیر حرکات قیمت را در بر میگیرند.
۲. مقادیر و تنظیمات باندها
باندهای بالا و پایین معمولاً بر اساس درصد مشخصی از خط میانگین متحرک محاسبه و رسم میشوند. به عنوان نمونه، در تنظیمات استاندارد ممکن است از انحراف 2% برای هر دو باند بالایی و پایینی استفاده شود.
۳. تحلیل نوسانات بازار
پهن شدن و افزایش فاصله بین باندها، سیگنالی از افزایش نوسانات (Volatility) بازار و احتمال وقوع تغییرات شدید قیمتی است؛ در مقابل، کاهش فاصله باندها نشاندهنده افت نوسانات و ورود به یک بازار رنج و کمحرکت است.
۴. سیگنالهای ورود و خروج
معمولاً زمانی که قیمت به باند پایینی میرسد (اشباع فروش)، میتواند موقعیتی برای ورود به معامله خرید باشد. از سوی دیگر، لمس باند بالایی توسط قیمت و کاهش فاصله باندها، معمولاً به عنوان سیگنال خروج از معامله در نظر گرفته میشود.
۵. ترکیب با سایر ابزارها
برای دریافت تاییدیههای قویتر و جلوگیری از سیگنالهای خطا، مووینگ اوریج انولوپ همواره باید با سایر اندیکاتورهای تحلیل تکنیکال (مانند RSI یا مکدی) و استراتژیهای معاملاتی ترکیب شود.
استفاده موفقیتآمیز از اندیکاتور مووینگ اوریج نیازمند تجربه و درک صحیح از شرایط لحظهای بازار است. معاملهگران حرفهای هرگز به یک ابزار به تنهایی بسنده نمیکنند و همواره مدیریت ریسک و سرمایه را در اولویت استراتژی معاملاتی خود قرار میدهند.
سیگنال گیری با اندیکاتور مووینگ اوریج

به زبان ساده، در زمان استفاده از اندیکاتور میانگین متحرک (MA) یا همان مووینگ اوریج، هرگاه قیمت پایینتر از میانگین متحرک باشد، سیگنال فروش ایجاد میشود. و هرگاه قیمت بالاتر از میانگین متحرک باشد، سیگنال خرید ایجاد میشود. اما لازم به توجه است که تنها با پایین یا بالابودن قیمتها نمیتوان سیگنالگیری کرد.
به عبارت دیگر، ما روند گیری میکنیم به این صورت که هرگاه قیمتها بالاتر از میانگین متحرک باشند، ممکن است در یک روند صعودی باشیم و برعکس، هرگاه قیمتها پایینتر از میانگین متحرک باشند، ممکن است در یک روند نزولی باشیم.
عدد مورد استفاده در دوره اندیکاتور مووینگ اوریج یا همان اندیکاتور میانگین متحرک، هرچقدر کمتر باشد، نوسانات و برخوردهای بیشتر اندیکاتور با چارت را مشاهده خواهیم کرد. در این حالت احتمال خطا بیشتر میشود و باید به آن توجه داشت.
از سوی دیگر، هرچقدر دوره بزرگتر باشد، نوسان کمتر توسط اندیکاتور میانگین متحرک ثبت خواهد شد. در نتیجه، سیگنالهای کمتری نیز ثبت میشوند و احتمال اینکه موقعیتهای خرید یا فروش فوقالعاده ای را از دست بدهیم، هم وجود دارد. بنابراین در انتخاب دوره باید بسیار دقت کرد. گرچه یک راهکار ساده برای این مشکل وجود دارد و آن استفاده از دو یا چند اندیکاتور میانگین متحرک است.
استفاده از چند اندیکاتور میانگین متحرک MA
شما با دو یا چند اندیکاتور مووینگ اوریج یا همان اندیکاتور میانگین متحرک میتوانید نسبت به فیلتر کردن اقدام کنید. به تصویر زیر دقت کنید:
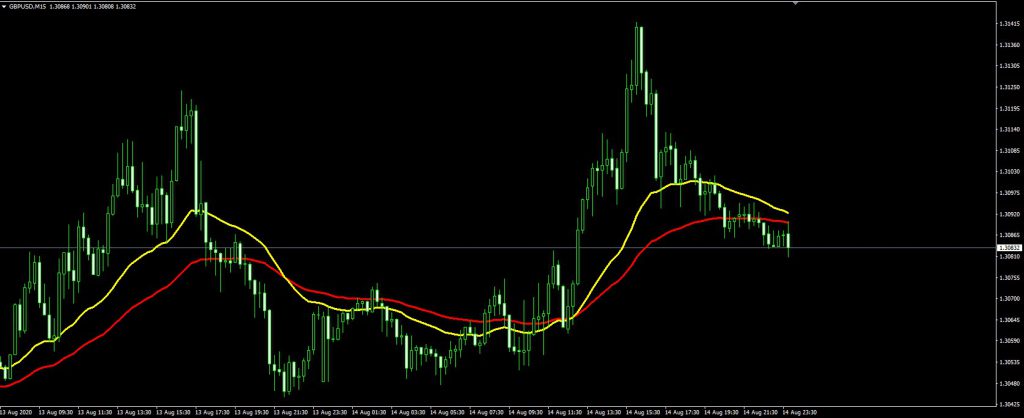
در تصویر بالا ما از دو میانگین متحرک ۶۰ و ۳۰ استفاده کرده این هرگاه میانگین متحرک ۳۰ بتواند میانگین متحرک ۶۰ را قطع کند در جهت قطع شدن پس از تثبیت میتوان اقدام به روند گیری و معامله کرد البته این تنها فاکتور برای یک ورود به معامله نخواهد بود.
شما ممکن است بخواهید از سه اندیکاتور مووینگ اوریج استفاده کنید با سه دوره متفاوت بازهم مشکلی نیست. به تصویر زیر دقت کنید:
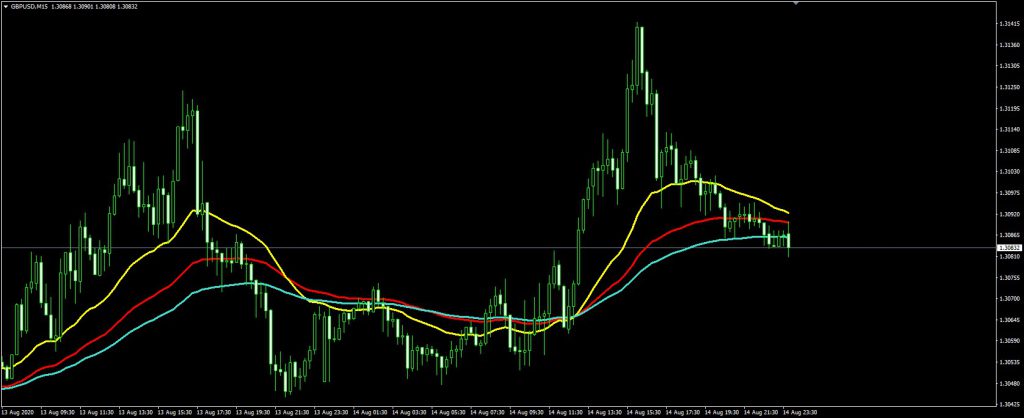
در چارت بالا ما علاوه بر دو میانگین متحرک ۳۰ و ۶۰ یک میانگین متحرک ۹۰ نیز اضافه کردیم که طبق فرمول بالا میتوانید از آن استفاده کنید.
شما بواسطه اندیکاتور میانگین متحرک یا همان اندیکاتور مووینگ اوریج میتوانید استراتژی های مختلفی ایجاد کنید و حتی میتوانید نسبت به فیلتر کردن استراتژی های خودتان نیز اقدام کنید.
نکته: همانطور که در تصویر میبینید رنگ هر اندیکاتور مووینگ اوریج از بخش تنظیمات آن قابل تغییر است. به تصویر زیر نگاه کنید:
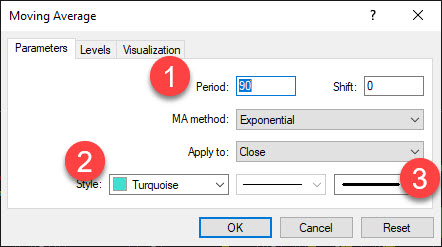
- ذر این بخش میتوانید بازه زمانی برای میانگین گیری را وارد کنید
- تغییر رنگ خط رسم شده بر روی چارت
- تنظیم سایز خط و شکل آن
اندیکاتور میانگین متحرک یا Moving Average یکی از کاربردیترین ابزارهای تحلیل تکنیکال برای شناسایی دقیق سطوح حمایت و مقاومت داینامیک (پویا) در بازارهای مالی به شمار میرود. این اندیکاتور با رسم خطوط هموار روی نمودار قیمت، به معاملهگران کمک میکند تا نواحی کلیدی بازگشت روند را به سادگی تشخیص دهند.
مکانیسم تعیین حمایت و مقاومت به این شکل است که در روندهای صعودی قدرتمند، خطوط مووینگ اوریج معمولاً در زیر کندلهای قیمتی قرار گرفته و به عنوان یک حمایت مستحکم عمل میکنند. در مقابل، هنگام شکلگیری روندهای نزولی، این خطوط بالاتر از قیمت حرکت کرده و نقش یک مقاومت مانعشونده را ایفا میکنند. تقاطع قیمت با این خطوط و شکست آنها به سمت مخالف، سیگنال هشداردهندهای از احتمال تغییر روند است. پس از این شکست (کراساوور)، طبق اصل تبدیل سطوح، حمایتِ شکسته شده میتواند به یک مقاومت جدید تبدیل گردد و بالعکس.
از آنجا که پلتفرمهای معاملاتی اجازه میدهند چندین اندیکاتور MA با دورههای زمانی مختلف را به صورت همزمان روی چارت فراخوانی کنید، میتوانید شبکهای از نقاط حمایت و مقاومت معتبر را ترسیم نمایید. این تکنیک باعث میشود تحلیل بسیار دقیقتری از قدرت روند و نقاط ورود و خروج احتمالی داشته باشید.
تذکرات مهم معاملاتی:
- به هیچ وجه نباید صرفاً با تکیه بر کراساوورها یا برخورد به خطوط Moving Average اقدام به باز کردن پوزیشن معاملاتی کنید؛ همیشه به تاییدیههای پرایس اکشن نیاز دارید.
- این ابزار در دسته اندیکاتورهای تاخیری (Lagging) و اصلاحی قرار میگیرد، بنابراین سیگنالهای آن بر اساس دیتای گذشته بازار صادر میشود و باید به این ویژگی دقت کنید.
- دوره زمانی (Period) اندیکاتور را هرگز به صورت تصادفی انتخاب نکنید؛ این عدد باید دقیقاً متناسب با تایمفریم و استراتژی معاملاتی شخصی شما بررسی و تنظیم شود.
سوالات متداول در خصوص اندیکاتور مووینگ اوریج
مقاله مووینگ اوریج رو خوندم و واقعا دم شما گرم، خیلی خوب و ساده توضیح دادین کاربردشو. من خودم بیشتر با SMA کار میکنم تو تحلیل تکنیکال برای تشخیص روند، ولی گاهی اوقات تو تایم فریمهای پایینتر مثل ۱۵ دقیقه یا ۳۰ دقیقه، سیگنالهای کاذبش اذیتم میکنه. میخواستم ببینم برای نوسانگیری با EMA تو تایم فریمهای کوتاه، مثلاً ۵ دقیقه، چه دورههایی رو پیشنهاد میکنین که کمتر نویز داشته باشه و سیگنالهای ورود و خروجم دقیقتر باشن؟ بیشتر استراتژی تقاطع رو دوست دارم استفاده کنم.
با تشکر از نظر ارزشمند شما و اینکه تجربه خودتون رو با ما به اشتراک گذاشتید. خیلی خوشحالیم که مقاله براتون مفید بوده. در مورد سوالتون راجع به استفاده از EMA برای نوسانگیری در تایمفریم ۵ دقیقه و کاهش نویز در استراتژی تقاطع، معمولاً تریدرها از ترکیب EMAهای نسبتاً سریعتر استفاده میکنن. برای تایمفریمهای کوتاه مثل ۵ دقیقه، ترکیبهایی مثل EMA (۹) و EMA (۲۱) یا EMA (۱۲) و EMA (۲۶) بسیار رایج هستن. EMA با دوره کوتاهتر (مثلاً ۹ یا ۱۲) به قیمت حساستره و به عنوان خط سریعتر عمل میکنه، در حالی که EMA با دوره بلندتر (مثلاً ۲۱ یا ۲۶) کندتره و به عنوان فیلتر نویز عمل میکنه. وقتی خط سریعتر، خط کندتر رو به سمت بالا قطع میکنه (Golden Cross)، سیگنال خرید و وقتی به سمت پایین قطع میکنه (Death Cross)، سیگنال فروش صادر میشه. برای کاهش نویز و سیگنالهای کاذب، همیشه توصیه میکنیم که این استراتژی رو با سایر ابزارهای تحلیل تکنیکال مثل سطوح حمایت و مقاومت، الگوهای کندلی، یا حتی اندیکاتورهای تاییدکننده حجم ترکیب کنید. همچنین، حتماً قبل از استفاده در حساب واقعی، این ترکیب رو در حساب دمو و با بکتست کافی امتحان کنید تا بهترین تنظیمات رو برای سبک معاملاتی خودتون پیدا کنید. موفق باشید!