Once again we are here with you to teach Stochastics indicator, version 2020.
In this post, we will review and introduce the stochastic indicator.
We also provide the basic tutorials for working with the stochastic indicator. It should be noted that this indicator is also one of those indicators in our study that has been widely used by Forex Analysts in 2019 and 2020.
Introducing the Stochastics Indicator
This indicator is also an oscillator because it oscillates and as other oscillators we introduced earlier like RSI, MACD and CCI oscillators works the same way.
This indicator also has a scaling between 0 and 100 and studies market fluctuations between these two levels.
calculating the stochastic indicator is according to the last price and it works in such a way that it studies whether we are near the top or bottom of the trend by comparing The close price with several other close prices in the specified periods.
It does not need further explanation because it is not practical to know and on the other hand all will be calculated by the indicator itself.
structure of stochastic indicator
as we explained above, the scale of fluctuation in the stochastic indicator is between 0 and 100.
Levels above 80 degrees are called overbought or and reading the levels under 20 are called oversold.
In stochastic oscillators, if the oscillator reaches a level below 20, it means our last price is close to the low in the last few periods, and if the price reaches above 80 means that our price is close to the high for the specified periods.
In the stochastic oscillator we have two percentage lines called K% and D% but the K% is of higher importance since most of the buy or sell signals in this indicator is Based on this line.
Of course, it should be noted that the K% line is more sensitive and reacts faster but the D line is less sensitive and reacts slowly.
In fact, line D is the moving average of the 3 periods of the line K.
You can change this average in the settings and replace it with any number you want.
This makes the D-line more accurate and ignores sensitive reactions.
Stochastic indicator settings
In the settings of the stochastic indicator, the default time period is 5.
But the 14 period is also very common and suitable. the smaller the period, more fluctuations stochastic oscillator will have and hence it will issue more signals.
More frequency of the signals, lower the accuracy and greater the probability of getting errors in the signals.
On the other hand, if our desired number of periods is larger than usual, the indicator will be slower and this will also make it hard to detect perfect buying or selling situations.
As a result, it will not react properly and will cause losses.
It is better to consider a moderate number, such as 14, for better reactions to neither act too slow nor too fast and over-exciting.
choosing the time period depends on your trading strategy and you can Change it whenever you like in the stochastic oscillator settings.
Divergence with stochastic indicator
Like RSI or MACD as we described, with this indicator you can Identify positive or negative divergences and trade accordingly.
In this post, we will not explain more about this, because in a separate detailed post We will explain divergences and teach you how to use it.
How to get signal with stochastic indicator
In stochastic oscillators, there are special conditions compared to other indicators.
In this section, we are going to discuss the buy or sell signal using a stochastic indicator.
How to get a Buy signal with stochastic indicator?
With Stochastic Oscillator, you can have buy signals considering three points:
⦁ slower line, or D%, if it was below 20 or oversold zone. ⦁ There is a positive divergence between the slower line or D% and the price. ⦁ The K% line has moved lower and gone below the D% line and then crossed it and moved upwards.
How to get sell signal using stochastic indicator
With Stochastic Oscillator, you can have sell signals considering the following points:
⦁ The slower line, or D%, should be in the overbought zone, i.e. above the level 80. ⦁ There is a negative divergence between the D% line and the price chart. ⦁ The K% line moved down from the top of the D% line and was able to cross it and move downwards.
Take a look at the image below to have a better understanding:
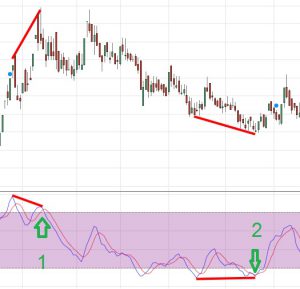
Stochastic indicator buy and sell signal
As you can see in the picture above, we see a negative divergence.
The D% line is also in the overbought and the other line above has been able to Moved down and cross the red line and move below it.
In this case, when all the points have been considered, a sell signal will be issued and as you can see, the signal worked well and the price has fallen.
In the second part, the D% line is in the oversold zone, after crossing the line D% by the line K% and crossing it upwards We are seeing the formation of a buy signal and we see a further increase in price.
A few tips about the stochastic indicator
⦁ In the settings of the stochastic indicator you can change the settings. For example, you can define your desired period for each of the lines. ⦁ The color of the lines in the stochastic oscillator can also be adjusted and changed. It is available in the settings section. These settings are completely upon you and can be adjusted to your preference. ⦁ periods for stochastic indicator can be adjusted to daily, weekly, monthly and even higher. ⦁ As mentioned in the case of oscillators, you cannot enter the market and trade solely based on the signals issued by stochastic. It should be used along with other tools or your own personal strategy.
You need to follow these steps to reduce risk and the error rate in your strategy.
As a suggestion, you can use RSI or MACD indicators along with stochastic indicators as a supplement.
Together, these indicators can produce excellent signals.